
120 Hz and 5G. HP is presenting its best, AMD-equipped business notebook in the new EliteBook 845 G10. The Ryzen 9 Pro 7940HS offers a lot of performance and the EliteBook doesn’t have any weakness in other areas either. Only the RAM configuration is not optimal.
Andreas Osthoff, 👁 Andreas Osthoff (translated by Jacob Fisher), Published 🇩🇪
The EliteBook 840 series is HP’s category of high-quality 14-inch business laptops that compete directly with Lenovo’s ThinkPad T14s series. Just like Lenovo, HP offers the model with both Intel CPUs (EliteBook 840) and AMD processors (EliteBook 845). Above the EliteBook 840 is the EliteBook 1040 flagship, which (like the ThinkPad X1 Carbon) is only available with an Intel CPU.
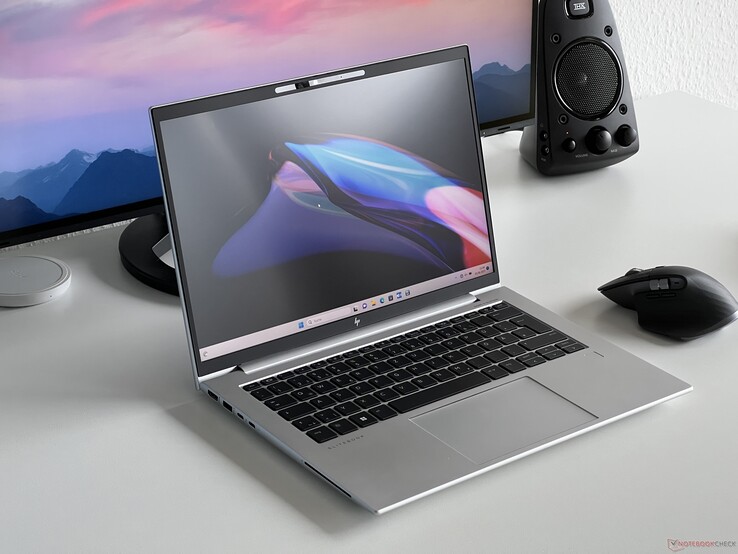
The 10th generation comes with minor updates, but the basic case design remains unchanged. Our test device is the HP EliteBook 845 G10 818N0EA for EUR 2,249 (or EUR 1,835 for students) and offers the new Zen4 processor AMD Ryzen 9 Pro 7940HS as well as a new 120 Hz screen with a resolution of 2,560 x 1,600. Other features include a 1 TB SSD, 32 GB of RAM, and a 5G modem.
Processor
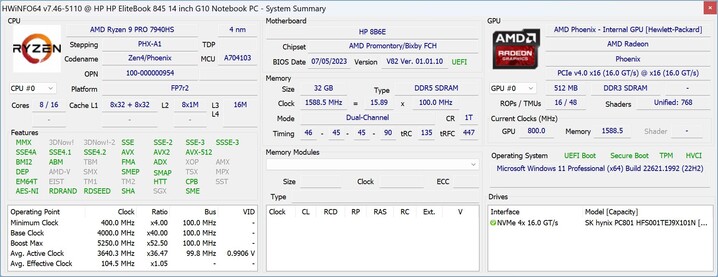
AMD Ryzen 9 PRO 7940HS 8 x 4 – 5.2 GHz, 51 W PL2 / Short Burst, 41 W PL1 / Sustained, Phoenix-HS (Zen 4)
Memory
32 GB
, DDR5-5600, single channel, 2 slots, max. 64 GB
Display
14.00 inch 16:10, 2560 x 1600 pixel 216 PPI, AUO6DA8, IPS, glossy: yes, 120 Hz
Mainboard
AMD Promontory/Bixby FCH
Soundcard
AMD Zen – Audio Processor – HD Audio Controller
Connections
2 USB 3.0 / 3.1 Gen1, 2 USB 4.0 40 Gbps, USB-C Power Delivery (PD), 1 HDMI, 2 DisplayPort, 1 Kensington Lock, Audio Connections: 3.5 mm Stereo, 1 SmartCard, 1 Fingerprint Reader, Brightness Sensor
Networking
Realtek 8852CE (a/b/g/n=Wi-Fi 4/ac=Wi-Fi 5/ax=Wi-Fi 6/ Wi-Fi 6E 6 GHz), Bluetooth 5.0, LTE, 5G
Size
height x width x depth (in mm): 17.9 x 323.6 x 214.7 (=0.7 x 12.74 x 8.45 in)
Battery
51 Wh, 4249 mAh Lithium-Polymer
Operating System
Microsoft Windows 11 Pro
Camera
Webcam: 5 MP with IR
Primary Camera: 5 MPix
Additional features
Speakers: Stereo, Keyboard: Chiclet, Keyboard Light: yes, 65W PSU, 36 Months Warranty
Weight
1.466 kg (= 51.71 oz / 3.23 pounds), Power Supply: 314 g (= 11.08 oz / 0.69 pounds)
Note: The manufacturer may use components from different suppliers including display panels, drives or memory sticks with similar specifications.
HP mainly uses aluminum for the case of the EliteBook 845 G10 and the build does not differ from last year’s G9 model. The silver-colored case is overall very restrained and does not have any color contrasts apart from the reflective HP logo on the lid and the black keyboard. The surfaces are overall very fingerprint- and dirt resistant.
The stability of the base unit is very good and no creaking noises are emitted. The hinges are well adjusted and the maximum opening angle is 180 degrees. The display lid itself is a little more flexible, but we were unable to elicit any image distortions. The screen bezels on the sides are very narrow and only a bit thicker above and below, but there is no camera hump.
At 1.466 kg, the EliteBook 845 G10 is no lightweight and also lands in last place in our comparison group. It is also a little wider than rival devices, but not quite as thick. The very compact 65-watt power supply adds another 300 grams to the scales.
{element.classList.add(‘hideEl’)});document.getElementById(‘showDeviceSizelabel_339665’).checked=false;document.querySelectorAll(‘#showDeviceSize_333488’).forEach(element=> {element.classList.add(‘hideEl’)});document.getElementById(‘showDeviceSizelabel_333488’).checked=false;document.querySelectorAll(‘#showDeviceSize_339036’).forEach(element=> {element.classList.add(‘hideEl’)});document.getElementById(‘showDeviceSizelabel_339036’).checked=false;document.querySelectorAll(‘#showDeviceSize_338054’).forEach(element=> {element.classList.add(‘hideEl’)});document.getElementById(‘showDeviceSizelabel_338054’).checked=false;document.querySelectorAll(‘#showDeviceSize_333150’).forEach(element=> {element.classList.add(‘hideEl’)});document.getElementById(‘showDeviceSizelabel_333150’).checked=false;return false;” title=”hide all”>❌
The port selection is very good. Apart from a card reader, all important ports, including a SmartCard reader (e.g. for company ID cards), are available. The two USB-C ports support the USB 4.0 standard and thus allow the connecting of external graphics cards.
The WLAN module comes from Realtek (8852CE) and also supports the current Wi-Fi 6E standard. We were able to connect to the corresponding 6 GHz network of our Asus reference router without issue in our tests. Transfer rates and signal stability are excellent, and the results are better than those of the competition. A network port is not available, but can be added via an optional USB adapter. In addition, a 5G modem from Fibocom is installed in our test device (FM350GL) and you can use either a nano-SIM card or an eSIM.
| Networking | |
| HP EliteBook 845 G10 818N0EA Realtek 8852CE |
|
| iperf3 transmit AXE11000 6GHz |
|
| iperf3 receive AXE11000 6GHz |
|
| Lenovo ThinkPad T14s G3 21CQ002LGE Qualcomm WCN685x |
|
| iperf3 transmit AXE11000 |
|
| iperf3 receive AXE11000 |
|
| Dell Latitude 7440 Intel Wi-Fi 6E AX211 |
|
| iperf3 transmit AXE11000 |
|
| iperf3 receive AXE11000 |
|
| iperf3 transmit AXE11000 6GHz |
|
| iperf3 receive AXE11000 6GHz |
|
| Huawei MateBook X Pro 2023 Intel Wi-Fi 6E AX211 |
|
| iperf3 transmit AXE11000 |
|
| iperf3 receive AXE11000 |
|
| iperf3 transmit AXE11000 6GHz |
|
| iperf3 receive AXE11000 6GHz |
|
| SCHENKER Vision 14 2022 RTX 3050 Ti Intel Wi-Fi 6 AX201 |
|
| iperf3 transmit AXE11000 |
|
| iperf3 receive AXE11000 |
|
| HP EliteBook 845 G9 6F6H6EA Qualcomm Fast Connect 6900 Wi-Fi 6E Dual Band Simultaneous |
|
| iperf3 transmit AXE11000 6GHz |
|
| iperf3 receive AXE11000 6GHz |
|
HP installs a 5 MP camera and the image quality is significantly better than the usual 1080p models, especially in terms of image sharpness. The color accuracy is not optimal, but you can easily do without an external webcam, especially for video conferences. An IR camera is also installed for facial recognition via Windows Hello.

12.7 ∆E
14.6 ∆E
22.1 ∆E
20.9 ∆E
18.7 ∆E
15.6 ∆E
10.7 ∆E
20.2 ∆E
14.1 ∆E
10.4 ∆E
15.4 ∆E
10.6 ∆E
9.4 ∆E
15.2 ∆E
16.7 ∆E
10.6 ∆E
14.7 ∆E
19.9 ∆E
2.3 ∆E
12 ∆E
12.9 ∆E
10.6 ∆E
8.3 ∆E
5.8 ∆E
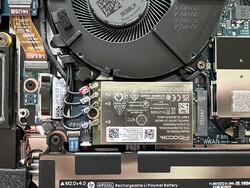
The base plate is secured with five regular Phillips screws and is easy to remove. The maintenance options are overall very good because there are two RAM slots next to the SSD. These are located under additional covers, but they are only clamped. The WLAN and WWAN modules are also plugged in.
The keyboard of the EliteBook 845 G10 is one of the best laptop keyboards on the market. Key travel is around 1.5 mm and the feedback is very precise. Subjectively, we prefer this keyboard more than in the current ThinkPad models. The only two aspects that require getting used to are the small arrow keys and the power button, of which the latter is integrated into the top right of the keyboard. The fingerprint scanner is located below the keyboard.
HP has been doing away with the pointstick in the middle of the keyboard and the accompanying dedicated mouse buttons for some time now and uses a regular ClickPad instead. However, this is not necessarily a drawback and the ClickPad works very well. The smooth surface offers good gliding properties and implements all inputs (including multi-touch gestures) without limitations.
HP offers various displays for the EliteBook 845 G10. We cannot recommend the 250 nits IPS display (which is not available in all regions) or the SureView display (up to 1,000 nits, but poor subjective image quality). On the other hand, the 400 nits IPS display (Full HD) is a solid screen that offers the best runtimes thanks to lower power consumption. The optional 120 Hz IPS display with 2560×1600 and an anti-glare surface is installed in our test device. The screen is not completely matte, but reflections are minimal.
Our subjective impression of the picture quality is overall very good because colors look vivid and content is very sharp. Bright areas appear slightly grainy at very short distances, but this is not an issue at a normal sitting distance. HP specifies a brightness of 500 cd/m², which is clearly exceeded by our test device at an average of 560 cd/m². The black value of 0.38 cd/m² suffers a little under the high brightness, but the overall contrast ratio is still nearly 1500:1. PWM is not used and the response times are very good for an IPS panel, but there are slighly visible halos, especially at the upper edge.
| 542 cd/m² |
525 cd/m² |
591 cd/m² |
||
| 567 cd/m² |
546 cd/m² |
608 cd/m² |
||
| 560 cd/m² |
536 cd/m² |
599 cd/m² |
||
Distribution of brightness
AUO6DA8
X-Rite i1Pro 2
Maximum: 608 cd/m² (Nits) Average: 563.8 cd/m² Minimum: 26.6 cd/m²
Brightness Distribution: 86 %
Center on Battery: 549 cd/m²
Contrast: 1437:1 (Black: 0.38 cd/m²)
ΔE Color 1.3 | 0.55-29.43 Ø5.1, calibrated: 1.2
ΔE Greyscale 1.1 | 0.57-98 Ø5.4
86.2% AdobeRGB 1998 (Argyll 2.2.0 3D)
99.8% sRGB (Argyll 2.2.0 3D)
98.3% Display P3 (Argyll 2.2.0 3D)
Gamma: 2.27
| HP EliteBook 845 G10 818N0EA AUO6DA8, IPS, 2560×1600, 14.00 |
Lenovo ThinkPad T14s G3 21CQ002LGE MNE007JA1-1, LTPS IPS LED, 1920×1200, 14.00 |
Dell Latitude 7440 AU Optronics B140QAX, IPS, 2560×1600, 14.00 |
Huawei MateBook X Pro 2023 TMX1422, IPS, 3120×2080, 14.20 |
SCHENKER Vision 14 2022 RTX 3050 Ti MNE007ZA1-1, IPS, 2880×1800, 14.00 |
HP EliteBook 845 G9 6F6H6EA InfoVision X140NV4J, IPS, 1920×1200, 14.00 |
|
|---|---|---|---|---|---|---|
| Display |
-15% |
-12% |
-4% |
-13% |
-17% |
|
| Display P3 Coverage |
98.3 |
69.4 -29% |
75.4 -23% |
89.8 -9% |
74.1 -25% |
69 -30% |
| sRGB Coverage |
99.8 |
99.8 0% |
99.9 0% |
99.4 0% |
97.4 -2% |
99 -1% |
| AdobeRGB 1998 Coverage |
86.2 |
71.4 -17% |
76.2 -12% |
84.2 -2% |
75.3 -13% |
70 -19% |
| Response Times |
-189% |
-316% |
-23% |
-116% |
-155% |
|
| Response Time Grey 50% / Grey 80% * |
12.7 {el.classList.toggle(‘hideEl’);});return false;”>?(5.8, 7) |
36.3 {el.classList.toggle(‘hideEl’);});return false;”>?(16.4, 19.8) -186% |
56 {el.classList.toggle(‘hideEl’);});return false;”>?(26.1, 29.9) -341% |
20 {el.classList.toggle(‘hideEl’);});return false;”>?(6, 14) -57% |
31.5 {el.classList.toggle(‘hideEl’);});return false;”>?(14, 17.5) -148% |
31 {el.classList.toggle(‘hideEl’);});return false;”>?(15, 16) -144% |
| Response Time Black / White * |
7.9 {el.classList.toggle(‘hideEl’);});return false;”>?(4.1, 3.8) |
23.1 {el.classList.toggle(‘hideEl’);});return false;”>?(10.4, 12.7) -192% |
30.8 {el.classList.toggle(‘hideEl’);});return false;”>?(14, 16.8) -290% |
7 {el.classList.toggle(‘hideEl’);});return false;”>?(2, 5) 11% |
14.5 {el.classList.toggle(‘hideEl’);});return false;”>?(4.7, 9.8) -84% |
21 {el.classList.toggle(‘hideEl’);});return false;”>?(12, 9) -166% |
| PWM Frequency |
156000 {el.classList.toggle(‘hideEl’);});return false;”>?(50) |
|||||
| Screen |
3% |
-66% |
-14% |
-59% |
-50% |
|
| Brightness middle |
546 |
396 -27% |
517.3 -5% |
595 9% |
421 -23% |
678 24% |
| Brightness |
564 |
379 -33% |
488 -13% |
550 -2% |
416 -26% |
745 32% |
| Brightness Distribution |
86 |
92 7% |
88 2% |
85 -1% |
89 3% |
69 -20% |
| Black Level * |
0.38 |
0.26 32% |
0.34 11% |
0.25 34% |
0.28 26% |
0.33 13% |
| Contrast |
1437 |
1523 6% |
1521 6% |
2380 66% |
1504 5% |
2055 43% |
| Colorchecker dE 2000 * |
1.3 |
1.3 -0% |
3.3 -154% |
2.01 -55% |
3.2 -146% |
3.56 -174% |
| Colorchecker dE 2000 max. * |
5.3 |
2.7 49% |
7.81 -47% |
6.9 -30% |
5.5 -4% |
7.23 -36% |
| Colorchecker dE 2000 calibrated * |
1.2 |
0.7 42% |
1.02 15% |
1.22 -2% |
2 -67% |
1.05 12% |
| Greyscale dE 2000 * |
1.1 |
1.6 -45% |
5.6 -409% |
2.74 -149% |
4.4 -300% |
4.93 -348% |
| Gamma |
2.27 97% |
2.14 103% |
2.37 93% |
2.4 92% |
2.22 99% |
2.63 84% |
| CCT |
6463 101% |
6554 99% |
6804 96% |
6319 103% |
6384 102% |
7114 91% |
| Total Average (Program / Settings) |
-67% / |
-131% / |
-14% / |
-63% / |
-74% / |
* … smaller is better
The panel is already very well calibrated in its delivery state. Our analysis with professional CalMAN software (X-Rite i1 Pro 2) reveals that the grayscale display is already on the reference level and no color cast is visible. In terms of colors, only blue is above the important deviation of 3, which are unable to correct via our own calibration. The P3 color space is fully covered, but there is no option to switch the color space to sRGB.
Display Response Times
ℹ
Display response times show how fast the screen is able to change from one color to the next. Slow response times can lead to afterimages and can cause moving objects to appear blurry (ghosting). Gamers of fast-paced 3D titles should pay special attention to fast response times.
| ↔ Response Time Black to White | ||
|---|---|---|
| 7.9 ms … rise ↗ and fall ↘ combined | ↗ 4.1 ms rise |
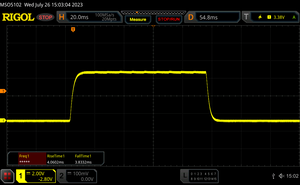 |
| ↘ 3.8 ms fall | ||
| The screen shows very fast response rates in our tests and should be very well suited for fast-paced gaming. In comparison, all tested devices range from 0.1 (minimum) to 240 (maximum) ms. » 14 % of all devices are better. This means that the measured response time is better than the average of all tested devices (22 ms). |
||
| ↔ Response Time 50% Grey to 80% Grey | ||
| 12.7 ms … rise ↗ and fall ↘ combined | ↗ 5.8 ms rise |
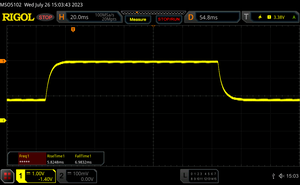 |
| ↘ 7 ms fall | ||
| The screen shows good response rates in our tests, but may be too slow for competitive gamers. In comparison, all tested devices range from 0.25 (minimum) to 636 (maximum) ms. » 18 % of all devices are better. This means that the measured response time is better than the average of all tested devices (34.7 ms). |
||
Screen Flickering / PWM (Pulse-Width Modulation)
ℹ
To dim the screen, some notebooks will simply cycle the backlight on and off in rapid succession – a method called Pulse Width Modulation (PWM) . This cycling frequency should ideally be undetectable to the human eye. If said frequency is too low, users with sensitive eyes may experience strain or headaches or even notice the flickering altogether.
| Screen flickering / PWM not detected |
 |
||
|
In comparison: 53 % of all tested devices do not use PWM to dim the display. If PWM was detected, an average of 18982 (minimum: 5 – maximum: 3846000) Hz was measured. |
|||
Thanks to the high screen brightness, you can often find a place outdoors where you can work properly. However, direct sunlight should be avoided. The viewing angle stability is good overall, but the image brightens up quickly, especially from an above angle. Better IPS panels are available here.

HP offers the EliteBook 845 G10 with the latest Ryzen CPUs from AMD. Our test device uses the fastest option, the 35-watt Ryzen 9 Pro 7940HS. Ryzen 5 or Ryzen 7 models of the U series are also optionally available. Our test device is also equipped with a 32 GB RAM module, which has a negative impact on graphics performance. Of course, this is not the most important factor in a business laptop, but it makes little sense not to utilize the hardware. We also ran some GPU and gaming benchmarks in dual-channel configuration (2x 16 GB DDR5-5600).
HP doesn’t offer any additional energy settings; the regular Windows profiles are used instead. The Ryzen 9 Pro 7940HS consumes a maximum of 51 watts, but 35 watts in the most energy-efficient mode. That is also the disadvantage of the HS processor because users don’t always need that much power in everyday office use. The U-series chips should have an advantage here because they can be configured with lower power limits.
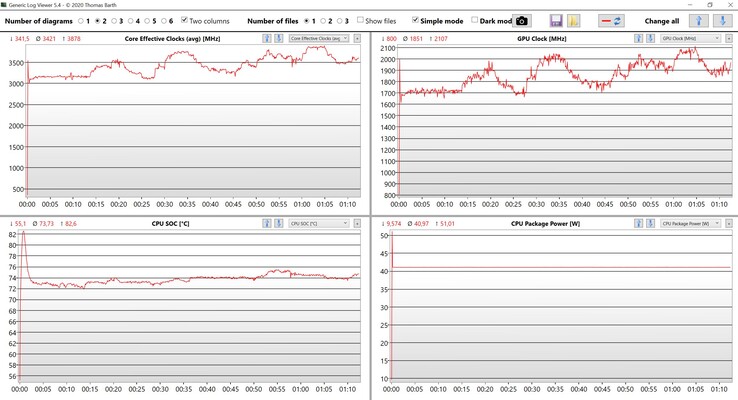
The Ryzen 9 Pro 7940HS stems from AMD’s current Phoenix generation and offers 8 Zen4 cores. The chip is manufactured in a modern 4 nm process and can run a maximum of 16 threads simultaneously. The chip consumes a maximum of 51 watts and 41 watts permanently, which leads to very good results in the benchmarks. Overall, performance remains very stable and all other comparison devices are clearly surpassed, at least in the multi-core benchmarks. The advantage over last year’s EliteBook 845 G9 with its Ryzen 9 Pro 6950HS is 19% on average, but single-core performance has increased only minimally. Intel still has an advantage here with the performance cores, although the power consumption is also higher. On battery power, CPU performance remains constant. More CPU benchmarks are available in our tech section.
| CPU Performance Rating | |
| HP EliteBook 845 G10 818N0EA AMD Ryzen 9 PRO 7940HS |
|
| Average AMD Ryzen 9 PRO 7940HS |
|
| SCHENKER Vision 14 2022 RTX 3050 Ti Intel Core i7-12700H |
|
| Huawei MateBook X Pro 2023 Intel Core i7-1360P |
|
| HP EliteBook 845 G9 6F6H6EA AMD Ryzen 9 PRO 6950HS |
|
| Dell Latitude 7440 Intel Core i5-1345U |
|
| Lenovo ThinkPad T14s G3 21CQ002LGE AMD Ryzen 7 PRO 6850U |
|
| Average of class Office |
|
| Cinebench R23 / Multi Core | |
| HP EliteBook 845 G10 818N0EA AMD Ryzen 9 PRO 7940HS |
|
| Average AMD Ryzen 9 PRO 7940HS |
|
| SCHENKER Vision 14 2022 RTX 3050 Ti Intel Core i7-12700H |
|
| Huawei MateBook X Pro 2023 Intel Core i7-1360P |
|
| HP EliteBook 845 G9 6F6H6EA AMD Ryzen 9 PRO 6950HS |
|
| Lenovo ThinkPad T14s G3 21CQ002LGE AMD Ryzen 7 PRO 6850U |
|
| Dell Latitude 7440 Intel Core i5-1345U |
|
| Average of class Office (830 – 14919, n=128, last 2 years) |
|
| Cinebench R23 / Single Core | |
| Huawei MateBook X Pro 2023 Intel Core i7-1360P |
|
| Dell Latitude 7440 Intel Core i5-1345U |
|
| SCHENKER Vision 14 2022 RTX 3050 Ti Intel Core i7-12700H |
|
| HP EliteBook 845 G10 818N0EA AMD Ryzen 9 PRO 7940HS |
|
| Average AMD Ryzen 9 PRO 7940HS |
|
| Lenovo ThinkPad T14s G3 21CQ002LGE AMD Ryzen 7 PRO 6850U |
|
| HP EliteBook 845 G9 6F6H6EA AMD Ryzen 9 PRO 6950HS |
|
| Average of class Office (321 – 1995, n=126, last 2 years) |
|
| Cinebench R20 / CPU (Multi Core) | |
| HP EliteBook 845 G10 818N0EA AMD Ryzen 9 PRO 7940HS |
|
| Average AMD Ryzen 9 PRO 7940HS |
|
| SCHENKER Vision 14 2022 RTX 3050 Ti Intel Core i7-12700H |
|
| HP EliteBook 845 G9 6F6H6EA AMD Ryzen 9 PRO 6950HS |
|
| Huawei MateBook X Pro 2023 Intel Core i7-1360P |
|
| Lenovo ThinkPad T14s G3 21CQ002LGE AMD Ryzen 7 PRO 6850U |
|
| Dell Latitude 7440 Intel Core i5-1345U |
|
| Average of class Office (323 – 5790, n=128, last 2 years) |
|
| Cinebench R20 / CPU (Single Core) | |
| Huawei MateBook X Pro 2023 Intel Core i7-1360P |
|
| SCHENKER Vision 14 2022 RTX 3050 Ti Intel Core i7-12700H |
|
| Dell Latitude 7440 Intel Core i5-1345U |
|
| HP EliteBook 845 G10 818N0EA AMD Ryzen 9 PRO 7940HS |
|
| Average AMD Ryzen 9 PRO 7940HS |
|
| Lenovo ThinkPad T14s G3 21CQ002LGE AMD Ryzen 7 PRO 6850U |
|
| HP EliteBook 845 G9 6F6H6EA AMD Ryzen 9 PRO 6950HS |
|
| Average of class Office (114 – 764, n=128, last 2 years) |
|
| Cinebench R15 / CPU Multi 64Bit | |
| HP EliteBook 845 G10 818N0EA AMD Ryzen 9 PRO 7940HS |
|
| Average AMD Ryzen 9 PRO 7940HS |
|
| SCHENKER Vision 14 2022 RTX 3050 Ti Intel Core i7-12700H |
|
| Huawei MateBook X Pro 2023 Intel Core i7-1360P |
|
| HP EliteBook 845 G9 6F6H6EA AMD Ryzen 9 PRO 6950HS |
|
| Lenovo ThinkPad T14s G3 21CQ002LGE AMD Ryzen 7 PRO 6850U |
|
| Dell Latitude 7440 Intel Core i5-1345U |
|
| Average of class Office (160.8 – 2492, n=127, last 2 years) |
|
| Cinebench R15 / CPU Single 64Bit | |
| Huawei MateBook X Pro 2023 Intel Core i7-1360P |
|
| SCHENKER Vision 14 2022 RTX 3050 Ti Intel Core i7-12700H |
|
| HP EliteBook 845 G10 818N0EA AMD Ryzen 9 PRO 7940HS |
|
| Average AMD Ryzen 9 PRO 7940HS |
|
| Dell Latitude 7440 Intel Core i5-1345U |
|
| Lenovo ThinkPad T14s G3 21CQ002LGE AMD Ryzen 7 PRO 6850U |
|
| HP EliteBook 845 G9 6F6H6EA AMD Ryzen 9 PRO 6950HS |
|
| Average of class Office (80.1 – 284, n=123, last 2 years) |
|
| Blender / v2.79 BMW27 CPU | |
| Average of class Office (215 – 3895, n=129, last 2 years) |
|
| Dell Latitude 7440 Intel Core i5-1345U |
|
| Lenovo ThinkPad T14s G3 21CQ002LGE AMD Ryzen 7 PRO 6850U |
|
| Huawei MateBook X Pro 2023 Intel Core i7-1360P |
|
| HP EliteBook 845 G9 6F6H6EA AMD Ryzen 9 PRO 6950HS |
|
| SCHENKER Vision 14 2022 RTX 3050 Ti Intel Core i7-12700H |
|
| HP EliteBook 845 G10 818N0EA AMD Ryzen 9 PRO 7940HS |
|
| Average AMD Ryzen 9 PRO 7940HS |
|
| 7-Zip 18.03 / 7z b 4 | |
| HP EliteBook 845 G10 818N0EA AMD Ryzen 9 PRO 7940HS |
|
| Average AMD Ryzen 9 PRO 7940HS |
|
| SCHENKER Vision 14 2022 RTX 3050 Ti Intel Core i7-12700H |
|
| HP EliteBook 845 G9 6F6H6EA AMD Ryzen 9 PRO 6950HS |
|
| Lenovo ThinkPad T14s G3 21CQ002LGE AMD Ryzen 7 PRO 6850U |
|
| Huawei MateBook X Pro 2023 Intel Core i7-1360P |
|
| Dell Latitude 7440 Intel Core i5-1345U |
|
| Average of class Office (4226 – 61303, n=128, last 2 years) |
|
| 7-Zip 18.03 / 7z b 4 -mmt1 | |
| HP EliteBook 845 G10 818N0EA AMD Ryzen 9 PRO 7940HS |
|
| Average AMD Ryzen 9 PRO 7940HS |
|
| SCHENKER Vision 14 2022 RTX 3050 Ti Intel Core i7-12700H |
|
| Huawei MateBook X Pro 2023 Intel Core i7-1360P |
|
| HP EliteBook 845 G9 6F6H6EA AMD Ryzen 9 PRO 6950HS |
|
| Lenovo ThinkPad T14s G3 21CQ002LGE AMD Ryzen 7 PRO 6850U |
|
| Dell Latitude 7440 Intel Core i5-1345U |
|
| Average of class Office (2059 – 6687, n=129, last 2 years) |
|
| Geekbench 5.4 / Multi-Core | |
| SCHENKER Vision 14 2022 RTX 3050 Ti Intel Core i7-12700H |
|
| HP EliteBook 845 G10 818N0EA AMD Ryzen 9 PRO 7940HS |
|
| Average AMD Ryzen 9 PRO 7940HS |
|
| Huawei MateBook X Pro 2023 Intel Core i7-1360P |
|
| Dell Latitude 7440 Intel Core i5-1345U |
|
| Lenovo ThinkPad T14s G3 21CQ002LGE AMD Ryzen 7 PRO 6850U |
|
| HP EliteBook 845 G9 6F6H6EA AMD Ryzen 9 PRO 6950HS |
|
| Average of class Office (1018 – 11744, n=126, last 2 years) |
|
| Geekbench 5.4 / Single-Core | |
| Huawei MateBook X Pro 2023 Intel Core i7-1360P |
|
| SCHENKER Vision 14 2022 RTX 3050 Ti Intel Core i7-12700H |
|
| HP EliteBook 845 G10 818N0EA AMD Ryzen 9 PRO 7940HS |
|
| Average AMD Ryzen 9 PRO 7940HS |
|
| Dell Latitude 7440 Intel Core i5-1345U |
|
| HP EliteBook 845 G9 6F6H6EA AMD Ryzen 9 PRO 6950HS |
|
| Lenovo ThinkPad T14s G3 21CQ002LGE AMD Ryzen 7 PRO 6850U |
|
| Average of class Office (531 – 1974, n=126, last 2 years) |
|
| HWBOT x265 Benchmark v2.2 / 4k Preset | |
| HP EliteBook 845 G10 818N0EA AMD Ryzen 9 PRO 7940HS |
|
| Average AMD Ryzen 9 PRO 7940HS |
|
| SCHENKER Vision 14 2022 RTX 3050 Ti Intel Core i7-12700H |
|
| HP EliteBook 845 G9 6F6H6EA AMD Ryzen 9 PRO 6950HS |
|
| Huawei MateBook X Pro 2023 Intel Core i7-1360P |
|
| Lenovo ThinkPad T14s G3 21CQ002LGE AMD Ryzen 7 PRO 6850U |
|
| Dell Latitude 7440 Intel Core i5-1345U |
|
| Average of class Office (0.63 – 17, n=128, last 2 years) |
|
| LibreOffice / 20 Documents To PDF | |
| HP EliteBook 845 G9 6F6H6EA AMD Ryzen 9 PRO 6950HS |
|
| Average of class Office (23.6 – 210, n=128, last 2 years) |
|
| Lenovo ThinkPad T14s G3 21CQ002LGE AMD Ryzen 7 PRO 6850U |
|
| HP EliteBook 845 G10 818N0EA AMD Ryzen 9 PRO 7940HS |
|
| Average AMD Ryzen 9 PRO 7940HS |
|
| Dell Latitude 7440 Intel Core i5-1345U |
|
| SCHENKER Vision 14 2022 RTX 3050 Ti Intel Core i7-12700H |
|
| Huawei MateBook X Pro 2023 Intel Core i7-1360P |
|
| R Benchmark 2.5 / Overall mean | |
| Average of class Office (0.4244 – 2.07, n=129, last 2 years) |
|
| Lenovo ThinkPad T14s G3 21CQ002LGE AMD Ryzen 7 PRO 6850U |
|
| HP EliteBook 845 G9 6F6H6EA AMD Ryzen 9 PRO 6950HS |
|
| Dell Latitude 7440 Intel Core i5-1345U |
|
| HP EliteBook 845 G10 818N0EA AMD Ryzen 9 PRO 7940HS |
|
| Average AMD Ryzen 9 PRO 7940HS |
|
| SCHENKER Vision 14 2022 RTX 3050 Ti Intel Core i7-12700H |
|
| Huawei MateBook X Pro 2023 Intel Core i7-1360P |
|
* … smaller is better
Cinebench R15 CPU Multi 64Bit
2360 Points
Cinebench R15 OpenGL 64Bit
137 fps
Cinebench R15 Ref. Match 64Bit
97.9 %
Cinebench R15 CPU Single 64Bit
247 Points
Help
| Performance Rating | |
| HP EliteBook 845 G10 818N0EA AMD Ryzen 9 PRO 7940HS, Radeon 780M |
|
| Average AMD Ryzen 9 PRO 7940HS |
|
| HP EliteBook 845 G9 6F6H6EA AMD Ryzen 9 PRO 6950HS, Radeon 680M |
|
| SCHENKER Vision 14 2022 RTX 3050 Ti Intel Core i7-12700H, GeForce RTX 3050 Ti Laptop GPU |
|
| Lenovo ThinkPad T14s G3 21CQ002LGE AMD Ryzen 7 PRO 6850U, Radeon 680M |
|
| Huawei MateBook X Pro 2023 Intel Core i7-1360P, Iris Xe G7 96EUs |
|
| Dell Latitude 7440 Intel Core i5-1345U, Iris Xe G7 80EUs |
|
| Average of class Office |
|
| AIDA64 / FP32 Ray-Trace | |
| HP EliteBook 845 G10 818N0EA AMD Ryzen 9 PRO 7940HS, Radeon 780M |
|
| Average AMD Ryzen 9 PRO 7940HS |
|
| HP EliteBook 845 G9 6F6H6EA AMD Ryzen 9 PRO 6950HS, Radeon 680M |
|
| SCHENKER Vision 14 2022 RTX 3050 Ti Intel Core i7-12700H, GeForce RTX 3050 Ti Laptop GPU |
|
| Lenovo ThinkPad T14s G3 21CQ002LGE AMD Ryzen 7 PRO 6850U, Radeon 680M |
|
| Huawei MateBook X Pro 2023 Intel Core i7-1360P, Iris Xe G7 96EUs |
|
| Dell Latitude 7440 Intel Core i5-1345U, Iris Xe G7 80EUs |
|
| Average of class Office (109 – 24250, n=128, last 2 years) |
|
| AIDA64 / FPU Julia | |
| HP EliteBook 845 G10 818N0EA AMD Ryzen 9 PRO 7940HS, Radeon 780M |
|
| Average AMD Ryzen 9 PRO 7940HS |
|
| HP EliteBook 845 G9 6F6H6EA AMD Ryzen 9 PRO 6950HS, Radeon 680M |
|
| Lenovo ThinkPad T14s G3 21CQ002LGE AMD Ryzen 7 PRO 6850U, Radeon 680M |
|
| SCHENKER Vision 14 2022 RTX 3050 Ti Intel Core i7-12700H, GeForce RTX 3050 Ti Laptop GPU |
|
| Huawei MateBook X Pro 2023 Intel Core i7-1360P, Iris Xe G7 96EUs |
|
| Dell Latitude 7440 Intel Core i5-1345U, Iris Xe G7 80EUs |
|
| Average of class Office (3414 – 101262, n=128, last 2 years) |
|
| AIDA64 / CPU SHA3 | |
| HP EliteBook 845 G10 818N0EA AMD Ryzen 9 PRO 7940HS, Radeon 780M |
|
| Average AMD Ryzen 9 PRO 7940HS |
|
| HP EliteBook 845 G9 6F6H6EA AMD Ryzen 9 PRO 6950HS, Radeon 680M |
|
| SCHENKER Vision 14 2022 RTX 3050 Ti Intel Core i7-12700H, GeForce RTX 3050 Ti Laptop GPU |
|
| Lenovo ThinkPad T14s G3 21CQ002LGE AMD Ryzen 7 PRO 6850U, Radeon 680M |
|
| Huawei MateBook X Pro 2023 Intel Core i7-1360P, Iris Xe G7 96EUs |
|
| Dell Latitude 7440 Intel Core i5-1345U, Iris Xe G7 80EUs |
|
| Average of class Office (125 – 4418, n=127, last 2 years) |
|
| AIDA64 / CPU Queen | |
| HP EliteBook 845 G10 818N0EA AMD Ryzen 9 PRO 7940HS, Radeon 780M |
|
| Average AMD Ryzen 9 PRO 7940HS |
|
| HP EliteBook 845 G9 6F6H6EA AMD Ryzen 9 PRO 6950HS, Radeon 680M |
|
| SCHENKER Vision 14 2022 RTX 3050 Ti Intel Core i7-12700H, GeForce RTX 3050 Ti Laptop GPU |
|
| Huawei MateBook X Pro 2023 Intel Core i7-1360P, Iris Xe G7 96EUs |
|
| Lenovo ThinkPad T14s G3 21CQ002LGE AMD Ryzen 7 PRO 6850U, Radeon 680M |
|
| Dell Latitude 7440 Intel Core i5-1345U, Iris Xe G7 80EUs |
|
| Average of class Office (3308 – 113016, n=128, last 2 years) |
|
| AIDA64 / FPU SinJulia | |
| HP EliteBook 845 G10 818N0EA AMD Ryzen 9 PRO 7940HS, Radeon 780M |
|
| Average AMD Ryzen 9 PRO 7940HS |
|
| HP EliteBook 845 G9 6F6H6EA AMD Ryzen 9 PRO 6950HS, Radeon 680M |
|
| Lenovo ThinkPad T14s G3 21CQ002LGE AMD Ryzen 7 PRO 6850U, Radeon 680M |
|
| SCHENKER Vision 14 2022 RTX 3050 Ti Intel Core i7-12700H, GeForce RTX 3050 Ti Laptop GPU |
|
| Huawei MateBook X Pro 2023 Intel Core i7-1360P, Iris Xe G7 96EUs |
|
| Average of class Office (404 – 14169, n=128, last 2 years) |
|
| Dell Latitude 7440 Intel Core i5-1345U, Iris Xe G7 80EUs |
|
| AIDA64 / FPU Mandel | |
| HP EliteBook 845 G10 818N0EA AMD Ryzen 9 PRO 7940HS, Radeon 780M |
|
| Average AMD Ryzen 9 PRO 7940HS |
|
| HP EliteBook 845 G9 6F6H6EA AMD Ryzen 9 PRO 6950HS, Radeon 680M |
|
| Lenovo ThinkPad T14s G3 21CQ002LGE AMD Ryzen 7 PRO 6850U, Radeon 680M |
|
| SCHENKER Vision 14 2022 RTX 3050 Ti Intel Core i7-12700H, GeForce RTX 3050 Ti Laptop GPU |
|
| Huawei MateBook X Pro 2023 Intel Core i7-1360P, Iris Xe G7 96EUs |
|
| Dell Latitude 7440 Intel Core i5-1345U, Iris Xe G7 80EUs |
|
| Average of class Office (1864 – 54003, n=128, last 2 years) |
|
| AIDA64 / CPU AES | |
| Huawei MateBook X Pro 2023 Intel Core i7-1360P, Iris Xe G7 96EUs |
|
| HP EliteBook 845 G10 818N0EA AMD Ryzen 9 PRO 7940HS, Radeon 780M |
|
| Average AMD Ryzen 9 PRO 7940HS |
|
| SCHENKER Vision 14 2022 RTX 3050 Ti Intel Core i7-12700H, GeForce RTX 3050 Ti Laptop GPU |
|
| HP EliteBook 845 G9 6F6H6EA AMD Ryzen 9 PRO 6950HS, Radeon 680M |
|
| Lenovo ThinkPad T14s G3 21CQ002LGE AMD Ryzen 7 PRO 6850U, Radeon 680M |
|
| Average of class Office (189 – 107331, n=128, last 2 years) |
|
| Dell Latitude 7440 Intel Core i5-1345U, Iris Xe G7 80EUs |
|
| AIDA64 / CPU ZLib | |
| HP EliteBook 845 G10 818N0EA AMD Ryzen 9 PRO 7940HS, Radeon 780M |
|
| Average AMD Ryzen 9 PRO 7940HS |
|
| SCHENKER Vision 14 2022 RTX 3050 Ti Intel Core i7-12700H, GeForce RTX 3050 Ti Laptop GPU |
|
| HP EliteBook 845 G9 6F6H6EA AMD Ryzen 9 PRO 6950HS, Radeon 680M |
|
| Huawei MateBook X Pro 2023 Intel Core i7-1360P, Iris Xe G7 96EUs |
|
| Lenovo ThinkPad T14s G3 21CQ002LGE AMD Ryzen 7 PRO 6850U, Radeon 680M |
|
| Dell Latitude 7440 Intel Core i5-1345U, Iris Xe G7 80EUs |
|
| Average of class Office (67.6 – 987, n=128, last 2 years) |
|
| AIDA64 / FP64 Ray-Trace | |
| HP EliteBook 845 G10 818N0EA AMD Ryzen 9 PRO 7940HS, Radeon 780M |
|
| Average AMD Ryzen 9 PRO 7940HS |
|
| HP EliteBook 845 G9 6F6H6EA AMD Ryzen 9 PRO 6950HS, Radeon 680M |
|
| SCHENKER Vision 14 2022 RTX 3050 Ti Intel Core i7-12700H, GeForce RTX 3050 Ti Laptop GPU |
|
| Lenovo ThinkPad T14s G3 21CQ002LGE AMD Ryzen 7 PRO 6850U, Radeon 680M |
|
| Huawei MateBook X Pro 2023 Intel Core i7-1360P, Iris Xe G7 96EUs |
|
| Dell Latitude 7440 Intel Core i5-1345U, Iris Xe G7 80EUs |
|
| Average of class Office (59 – 12755, n=128, last 2 years) |
|
| AIDA64 / CPU PhotoWorxx | |
| Huawei MateBook X Pro 2023 Intel Core i7-1360P, Iris Xe G7 96EUs |
|
| Dell Latitude 7440 Intel Core i5-1345U, Iris Xe G7 80EUs |
|
| SCHENKER Vision 14 2022 RTX 3050 Ti Intel Core i7-12700H, GeForce RTX 3050 Ti Laptop GPU |
|
| Lenovo ThinkPad T14s G3 21CQ002LGE AMD Ryzen 7 PRO 6850U, Radeon 680M |
|
| HP EliteBook 845 G10 818N0EA AMD Ryzen 9 PRO 7940HS, Radeon 780M |
|
| Average AMD Ryzen 9 PRO 7940HS |
|
| Average of class Office (2193 – 48177, n=128, last 2 years) |
|
| HP EliteBook 845 G9 6F6H6EA AMD Ryzen 9 PRO 6950HS, Radeon 680M |
|
The EliteBook 845 G10 is a very responsive laptop in everyday use and the RAM’s single-channel configuration does not have a negative impact here either. The synthetic benchmark results are also good; only in the cross-system CrossMark test do AMD systems perform a little weaker. No issues occurred during testing and we were able to upgrade the RAM without any problems.
| PCMark 10 / Score | |
| SCHENKER Vision 14 2022 RTX 3050 Ti GeForce RTX 3050 Ti Laptop GPU, i7-12700H, Samsung SSD 980 Pro 1TB MZ-V8P1T0BW |
|
| HP EliteBook 845 G10 818N0EA Radeon 780M, R9 PRO 7940HS, SK hynix PC801 HFS001TEJ9X101N |
|
| Average AMD Ryzen 9 PRO 7940HS, AMD Radeon 780M |
|
| Lenovo ThinkPad T14s G3 21CQ002LGE Radeon 680M, R7 PRO 6850U, SK Hynix PC711 512GB HFS512GDE9X081N |
|
| HP EliteBook 845 G9 6F6H6EA Radeon 680M, R9 PRO 6950HS, WDC PC SN810 1TB |
|
| Huawei MateBook X Pro 2023 Iris Xe G7 96EUs, i7-1360P |
|
| Dell Latitude 7440 Iris Xe G7 80EUs, i5-1345U, Samsung MZ9L4512HBLU-00BMV |
|
| Average of class Office (2325 – 6523, n=106, last 2 years) |
|
| PCMark 10 / Essentials | |
| Dell Latitude 7440 Iris Xe G7 80EUs, i5-1345U, Samsung MZ9L4512HBLU-00BMV |
|
| SCHENKER Vision 14 2022 RTX 3050 Ti GeForce RTX 3050 Ti Laptop GPU, i7-12700H, Samsung SSD 980 Pro 1TB MZ-V8P1T0BW |
|
| Huawei MateBook X Pro 2023 Iris Xe G7 96EUs, i7-1360P |
|
| HP EliteBook 845 G10 818N0EA Radeon 780M, R9 PRO 7940HS, SK hynix PC801 HFS001TEJ9X101N |
|
| Average AMD Ryzen 9 PRO 7940HS, AMD Radeon 780M |
|
| Lenovo ThinkPad T14s G3 21CQ002LGE Radeon 680M, R7 PRO 6850U, SK Hynix PC711 512GB HFS512GDE9X081N |
|
| Average of class Office (5095 – 11807, n=106, last 2 years) |
|
| HP EliteBook 845 G9 6F6H6EA Radeon 680M, R9 PRO 6950HS, WDC PC SN810 1TB |
|
| PCMark 10 / Productivity | |
| HP EliteBook 845 G10 818N0EA Radeon 780M, R9 PRO 7940HS, SK hynix PC801 HFS001TEJ9X101N |
|
| Average AMD Ryzen 9 PRO 7940HS, AMD Radeon 780M |
|
| Lenovo ThinkPad T14s G3 21CQ002LGE Radeon 680M, R7 PRO 6850U, SK Hynix PC711 512GB HFS512GDE9X081N |
|
| SCHENKER Vision 14 2022 RTX 3050 Ti GeForce RTX 3050 Ti Laptop GPU, i7-12700H, Samsung SSD 980 Pro 1TB MZ-V8P1T0BW |
|
| HP EliteBook 845 G9 6F6H6EA Radeon 680M, R9 PRO 6950HS, WDC PC SN810 1TB |
|
| Dell Latitude 7440 Iris Xe G7 80EUs, i5-1345U, Samsung MZ9L4512HBLU-00BMV |
|
| Huawei MateBook X Pro 2023 Iris Xe G7 96EUs, i7-1360P |
|
| Average of class Office (3053 – 9462, n=106, last 2 years) |
|
| PCMark 10 / Digital Content Creation | |
| SCHENKER Vision 14 2022 RTX 3050 Ti GeForce RTX 3050 Ti Laptop GPU, i7-12700H, Samsung SSD 980 Pro 1TB MZ-V8P1T0BW |
|
| HP EliteBook 845 G10 818N0EA Radeon 780M, R9 PRO 7940HS, SK hynix PC801 HFS001TEJ9X101N |
|
| Average AMD Ryzen 9 PRO 7940HS, AMD Radeon 780M |
|
| HP EliteBook 845 G9 6F6H6EA Radeon 680M, R9 PRO 6950HS, WDC PC SN810 1TB |
|
| Lenovo ThinkPad T14s G3 21CQ002LGE Radeon 680M, R7 PRO 6850U, SK Hynix PC711 512GB HFS512GDE9X081N |
|
| Huawei MateBook X Pro 2023 Iris Xe G7 96EUs, i7-1360P |
|
| Dell Latitude 7440 Iris Xe G7 80EUs, i5-1345U, Samsung MZ9L4512HBLU-00BMV |
|
| Average of class Office (1912 – 8299, n=106, last 2 years) |
|
| CrossMark / Overall | |
| Huawei MateBook X Pro 2023 Iris Xe G7 96EUs, i7-1360P |
|
| SCHENKER Vision 14 2022 RTX 3050 Ti GeForce RTX 3050 Ti Laptop GPU, i7-12700H, Samsung SSD 980 Pro 1TB MZ-V8P1T0BW |
|
| Lenovo ThinkPad T14s G3 21CQ002LGE Radeon 680M, R7 PRO 6850U, SK Hynix PC711 512GB HFS512GDE9X081N |
|
| HP EliteBook 845 G10 818N0EA Radeon 780M, R9 PRO 7940HS, SK hynix PC801 HFS001TEJ9X101N |
|
| Average AMD Ryzen 9 PRO 7940HS, AMD Radeon 780M |
|
| HP EliteBook 845 G9 6F6H6EA Radeon 680M, R9 PRO 6950HS, WDC PC SN810 1TB |
|
| Average of class Office (440 – 1773, n=90, last 2 years) |
|
| CrossMark / Productivity | |
| Huawei MateBook X Pro 2023 Iris Xe G7 96EUs, i7-1360P |
|
| SCHENKER Vision 14 2022 RTX 3050 Ti GeForce RTX 3050 Ti Laptop GPU, i7-12700H, Samsung SSD 980 Pro 1TB MZ-V8P1T0BW |
|
| Lenovo ThinkPad T14s G3 21CQ002LGE Radeon 680M, R7 PRO 6850U, SK Hynix PC711 512GB HFS512GDE9X081N |
|
| HP EliteBook 845 G10 818N0EA Radeon 780M, R9 PRO 7940HS, SK hynix PC801 HFS001TEJ9X101N |
|
| Average AMD Ryzen 9 PRO 7940HS, AMD Radeon 780M |
|
| HP EliteBook 845 G9 6F6H6EA Radeon 680M, R9 PRO 6950HS, WDC PC SN810 1TB |
|
| Average of class Office (513 – 1709, n=90, last 2 years) |
|
| CrossMark / Creativity | |
| Huawei MateBook X Pro 2023 Iris Xe G7 96EUs, i7-1360P |
|
| SCHENKER Vision 14 2022 RTX 3050 Ti GeForce RTX 3050 Ti Laptop GPU, i7-12700H, Samsung SSD 980 Pro 1TB MZ-V8P1T0BW |
|
| HP EliteBook 845 G10 818N0EA Radeon 780M, R9 PRO 7940HS, SK hynix PC801 HFS001TEJ9X101N |
|
| Average AMD Ryzen 9 PRO 7940HS, AMD Radeon 780M |
|
| Lenovo ThinkPad T14s G3 21CQ002LGE Radeon 680M, R7 PRO 6850U, SK Hynix PC711 512GB HFS512GDE9X081N |
|
| HP EliteBook 845 G9 6F6H6EA Radeon 680M, R9 PRO 6950HS, WDC PC SN810 1TB |
|
| Average of class Office (424 – 1875, n=90, last 2 years) |
|
| CrossMark / Responsiveness | |
| Huawei MateBook X Pro 2023 Iris Xe G7 96EUs, i7-1360P |
|
| SCHENKER Vision 14 2022 RTX 3050 Ti GeForce RTX 3050 Ti Laptop GPU, i7-12700H, Samsung SSD 980 Pro 1TB MZ-V8P1T0BW |
|
| Lenovo ThinkPad T14s G3 21CQ002LGE Radeon 680M, R7 PRO 6850U, SK Hynix PC711 512GB HFS512GDE9X081N |
|
| HP EliteBook 845 G10 818N0EA Radeon 780M, R9 PRO 7940HS, SK hynix PC801 HFS001TEJ9X101N |
|
| Average AMD Ryzen 9 PRO 7940HS, AMD Radeon 780M |
|
| HP EliteBook 845 G9 6F6H6EA Radeon 680M, R9 PRO 6950HS, WDC PC SN810 1TB |
|
| Average of class Office (284 – 1746, n=90, last 2 years) |
|
| PCMark 10 Score | 6523 points | |
|
Help |
||
| AIDA64 / Memory Copy | |
| Huawei MateBook X Pro 2023 Intel Core i7-1360P, Iris Xe G7 96EUs |
|
| Dell Latitude 7440 Intel Core i5-1345U, Iris Xe G7 80EUs |
|
| SCHENKER Vision 14 2022 RTX 3050 Ti Intel Core i7-12700H, GeForce RTX 3050 Ti Laptop GPU |
|
| Lenovo ThinkPad T14s G3 21CQ002LGE AMD Ryzen 7 PRO 6850U, Radeon 680M |
|
| Average of class Office (7158 – 71202, n=128, last 2 years) |
|
| HP EliteBook 845 G10 818N0EA AMD Ryzen 9 PRO 7940HS, Radeon 780M |
|
| Average AMD Ryzen 9 PRO 7940HS |
|
| HP EliteBook 845 G9 6F6H6EA AMD Ryzen 9 PRO 6950HS, Radeon 680M |
|
| AIDA64 / Memory Read | |
| Huawei MateBook X Pro 2023 Intel Core i7-1360P, Iris Xe G7 96EUs |
|
| Dell Latitude 7440 Intel Core i5-1345U, Iris Xe G7 80EUs |
|
| Lenovo ThinkPad T14s G3 21CQ002LGE AMD Ryzen 7 PRO 6850U, Radeon 680M |
|
| Average of class Office (7325 – 70553, n=128, last 2 years) |
|
| SCHENKER Vision 14 2022 RTX 3050 Ti Intel Core i7-12700H, GeForce RTX 3050 Ti Laptop GPU |
|
| HP EliteBook 845 G9 6F6H6EA AMD Ryzen 9 PRO 6950HS, Radeon 680M |
|
| HP EliteBook 845 G10 818N0EA AMD Ryzen 9 PRO 7940HS, Radeon 780M |
|
| Average AMD Ryzen 9 PRO 7940HS |
|
| AIDA64 / Memory Write | |
| Huawei MateBook X Pro 2023 Intel Core i7-1360P, Iris Xe G7 96EUs |
|
| Dell Latitude 7440 Intel Core i5-1345U, Iris Xe G7 80EUs |
|
| Lenovo ThinkPad T14s G3 21CQ002LGE AMD Ryzen 7 PRO 6850U, Radeon 680M |
|
| SCHENKER Vision 14 2022 RTX 3050 Ti Intel Core i7-12700H, GeForce RTX 3050 Ti Laptop GPU |
|
| Average of class Office (7579 – 88993, n=128, last 2 years) |
|
| HP EliteBook 845 G10 818N0EA AMD Ryzen 9 PRO 7940HS, Radeon 780M |
|
| Average AMD Ryzen 9 PRO 7940HS |
|
| HP EliteBook 845 G9 6F6H6EA AMD Ryzen 9 PRO 6950HS, Radeon 680M |
|
| AIDA64 / Memory Latency | |
| Lenovo ThinkPad T14s G3 21CQ002LGE AMD Ryzen 7 PRO 6850U, Radeon 680M |
|
| Huawei MateBook X Pro 2023 Intel Core i7-1360P, Iris Xe G7 96EUs |
|
| HP EliteBook 845 G10 818N0EA AMD Ryzen 9 PRO 7940HS, Radeon 780M |
|
| Average AMD Ryzen 9 PRO 7940HS |
|
| Dell Latitude 7440 Intel Core i5-1345U, Iris Xe G7 80EUs |
|
| HP EliteBook 845 G9 6F6H6EA AMD Ryzen 9 PRO 6950HS, Radeon 680M |
|
| Average of class Office (57.8 – 336, n=129, last 2 years) |
|
| SCHENKER Vision 14 2022 RTX 3050 Ti Intel Core i7-12700H, GeForce RTX 3050 Ti Laptop GPU |
|
* … smaller is better
The test device shows no limitations in our standardized latency test (web browsing, 4K YouTube playback, CPU load) with the present BIOS version. Hence, the use of real-time audio applications without errors is possible.
| DPC Latencies / LatencyMon – interrupt to process latency (max), Web, Youtube, Prime95 | |
| Huawei MateBook X Pro 2023 Iris Xe G7 96EUs, i7-1360P |
|
| HP EliteBook 845 G9 6F6H6EA Radeon 680M, R9 PRO 6950HS, WDC PC SN810 1TB |
|
| Dell Latitude 7440 Iris Xe G7 80EUs, i5-1345U, Samsung MZ9L4512HBLU-00BMV |
|
| SCHENKER Vision 14 2022 RTX 3050 Ti GeForce RTX 3050 Ti Laptop GPU, i7-12700H, Samsung SSD 980 Pro 1TB MZ-V8P1T0BW |
|
| HP EliteBook 845 G10 818N0EA Radeon 780M, R9 PRO 7940HS, SK hynix PC801 HFS001TEJ9X101N |
|
| Lenovo ThinkPad T14s G3 21CQ002LGE Radeon 680M, R7 PRO 6850U, SK Hynix PC711 512GB HFS512GDE9X081N |
|
* … smaller is better
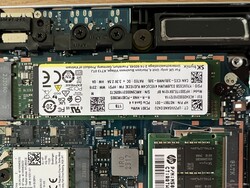
HP equips the EliteBook 845 G10 with a fast PCIe 4.0 slot for M.2 2280 SSDs and our test device has the 1 TB version of the SK hynix PC801 installed, with 895 GB available upon booting up for the first time. Transfer rates are very good overall and no performance drops occur under prolonged load. More SSD benchmarks are available here.
CDM 5/6 Read Seq Q32T1:
7123 MB/s
CDM 5/6 Write Seq Q32T1:
5911 MB/s
CDM 5/6 Read 4K Q32T1:
422 MB/s
CDM 5/6 Write 4K Q32T1:
441 MB/s
CDM 5/6 Read 4K:
62.8 MB/s
CDM 5/6 Write 4K:
127.8 MB/s
CDM 6 Write 4K Q8T8:
469 MB/s
CDM 6 Read 4K Q8T8:
1096 MB/s
| Drive Performance Rating – Percent | |
| SCHENKER Vision 14 2022 RTX 3050 Ti Samsung SSD 980 Pro 1TB MZ-V8P1T0BW |
|
| Average SK hynix PC801 HFS001TEJ9X101N |
|
| Huawei MateBook X Pro 2023 |
|
| HP EliteBook 845 G10 818N0EA SK hynix PC801 HFS001TEJ9X101N |
|
| HP EliteBook 845 G9 6F6H6EA WDC PC SN810 1TB |
|
| Lenovo ThinkPad T14s G3 21CQ002LGE SK Hynix PC711 512GB HFS512GDE9X081N |
|
| Dell Latitude 7440 Samsung MZ9L4512HBLU-00BMV |
|
| Average of class Office |
|
| DiskSpd | |
| seq read | |
| SCHENKER Vision 14 2022 RTX 3050 Ti Samsung SSD 980 Pro 1TB MZ-V8P1T0BW |
|
| Average SK hynix PC801 HFS001TEJ9X101N (2511 – 4861, n=8) |
|
| HP EliteBook 845 G9 6F6H6EA WDC PC SN810 1TB |
|
| HP EliteBook 845 G10 818N0EA SK hynix PC801 HFS001TEJ9X101N |
|
| Dell Latitude 7440 Samsung MZ9L4512HBLU-00BMV |
|
| Average of class Office (215 – 4278, n=106, last 2 years) |
|
| Huawei MateBook X Pro 2023 |
|
| Lenovo ThinkPad T14s G3 21CQ002LGE SK Hynix PC711 512GB HFS512GDE9X081N |
|
| seq write | |
| Average SK hynix PC801 HFS001TEJ9X101N (3566 – 5181, n=8) |
|
| SCHENKER Vision 14 2022 RTX 3050 Ti Samsung SSD 980 Pro 1TB MZ-V8P1T0BW |
|
| Huawei MateBook X Pro 2023 |
|
| HP EliteBook 845 G10 818N0EA SK hynix PC801 HFS001TEJ9X101N |
|
| HP EliteBook 845 G9 6F6H6EA WDC PC SN810 1TB |
|
| Lenovo ThinkPad T14s G3 21CQ002LGE SK Hynix PC711 512GB HFS512GDE9X081N |
|
| Average of class Office (56.3 – 4984, n=106, last 2 years) |
|
| Dell Latitude 7440 Samsung MZ9L4512HBLU-00BMV |
|
| seq q8 t1 read | |
| HP EliteBook 845 G9 6F6H6EA WDC PC SN810 1TB |
|
| SCHENKER Vision 14 2022 RTX 3050 Ti Samsung SSD 980 Pro 1TB MZ-V8P1T0BW |
|
| Average SK hynix PC801 HFS001TEJ9X101N (6570 – 7177, n=8) |
|
| HP EliteBook 845 G10 818N0EA SK hynix PC801 HFS001TEJ9X101N |
|
| Huawei MateBook X Pro 2023 |
|
| Lenovo ThinkPad T14s G3 21CQ002LGE SK Hynix PC711 512GB HFS512GDE9X081N |
|
| Dell Latitude 7440 Samsung MZ9L4512HBLU-00BMV |
|
| Average of class Office (200 – 6922, n=106, last 2 years) |
|
| seq q8 t1 write | |
| Average SK hynix PC801 HFS001TEJ9X101N (6037 – 6130, n=8) |
|
| HP EliteBook 845 G10 818N0EA SK hynix PC801 HFS001TEJ9X101N |
|
| HP EliteBook 845 G9 6F6H6EA WDC PC SN810 1TB |
|
| SCHENKER Vision 14 2022 RTX 3050 Ti Samsung SSD 980 Pro 1TB MZ-V8P1T0BW |
|
| Huawei MateBook X Pro 2023 |
|
| Lenovo ThinkPad T14s G3 21CQ002LGE SK Hynix PC711 512GB HFS512GDE9X081N |
|
| Average of class Office (57 – 6111, n=106, last 2 years) |
|
| Dell Latitude 7440 Samsung MZ9L4512HBLU-00BMV |
|
| 4k q1 t1 read | |
| SCHENKER Vision 14 2022 RTX 3050 Ti Samsung SSD 980 Pro 1TB MZ-V8P1T0BW |
|
| Dell Latitude 7440 Samsung MZ9L4512HBLU-00BMV |
|
| Average SK hynix PC801 HFS001TEJ9X101N (60.7 – 80, n=8) |
|
| HP EliteBook 845 G10 818N0EA SK hynix PC801 HFS001TEJ9X101N |
|
| Average of class Office (9.03 – 94.3, n=106, last 2 years) |
|
| Lenovo ThinkPad T14s G3 21CQ002LGE SK Hynix PC711 512GB HFS512GDE9X081N |
|
| HP EliteBook 845 G9 6F6H6EA WDC PC SN810 1TB |
|
| Huawei MateBook X Pro 2023 |
|
| 4k q1 t1 write | |
| Huawei MateBook X Pro 2023 |
|
| Average SK hynix PC801 HFS001TEJ9X101N (132.4 – 319, n=8) |
|
| SCHENKER Vision 14 2022 RTX 3050 Ti Samsung SSD 980 Pro 1TB MZ-V8P1T0BW |
|
| Average of class Office (14.3 – 292, n=106, last 2 years) |
|
| Lenovo ThinkPad T14s G3 21CQ002LGE SK Hynix PC711 512GB HFS512GDE9X081N |
|
| HP EliteBook 845 G10 818N0EA SK hynix PC801 HFS001TEJ9X101N |
|
| Dell Latitude 7440 Samsung MZ9L4512HBLU-00BMV |
|
| HP EliteBook 845 G9 6F6H6EA WDC PC SN810 1TB |
|
| 4k q32 t16 read | |
| SCHENKER Vision 14 2022 RTX 3050 Ti Samsung SSD 980 Pro 1TB MZ-V8P1T0BW |
|
| Average SK hynix PC801 HFS001TEJ9X101N (681 – 5829, n=8) |
|
| Huawei MateBook X Pro 2023 |
|
| Average of class Office (27.4 – 4425, n=106, last 2 years) |
|
| HP EliteBook 845 G9 6F6H6EA WDC PC SN810 1TB |
|
| HP EliteBook 845 G10 818N0EA SK hynix PC801 HFS001TEJ9X101N |
|
| Lenovo ThinkPad T14s G3 21CQ002LGE SK Hynix PC711 512GB HFS512GDE9X081N |
|
| Dell Latitude 7440 Samsung MZ9L4512HBLU-00BMV |
|
| 4k q32 t16 write | |
| SCHENKER Vision 14 2022 RTX 3050 Ti Samsung SSD 980 Pro 1TB MZ-V8P1T0BW |
|
| Average SK hynix PC801 HFS001TEJ9X101N (456 – 3719, n=8) |
|
| Huawei MateBook X Pro 2023 |
|
| Average of class Office (18.8 – 2831, n=106, last 2 years) |
|
| HP EliteBook 845 G10 818N0EA SK hynix PC801 HFS001TEJ9X101N |
|
| Lenovo ThinkPad T14s G3 21CQ002LGE SK Hynix PC711 512GB HFS512GDE9X081N |
|
| HP EliteBook 845 G9 6F6H6EA WDC PC SN810 1TB |
|
| Dell Latitude 7440 Samsung MZ9L4512HBLU-00BMV |
|
| AS SSD | |
| Score Total | |
| SCHENKER Vision 14 2022 RTX 3050 Ti Samsung SSD 980 Pro 1TB MZ-V8P1T0BW |
|
| Average SK hynix PC801 HFS001TEJ9X101N (5903 – 10562, n=8) |
|
| Huawei MateBook X Pro 2023 |
|
| HP EliteBook 845 G10 818N0EA SK hynix PC801 HFS001TEJ9X101N |
|
| HP EliteBook 845 G9 6F6H6EA WDC PC SN810 1TB |
|
| Lenovo ThinkPad T14s G3 21CQ002LGE SK Hynix PC711 512GB HFS512GDE9X081N |
|
| Dell Latitude 7440 Samsung MZ9L4512HBLU-00BMV |
|
| Average of class Office (125 – 9204, n=106, last 2 years) |
|
| Score Read | |
| SCHENKER Vision 14 2022 RTX 3050 Ti Samsung SSD 980 Pro 1TB MZ-V8P1T0BW |
|
| Huawei MateBook X Pro 2023 |
|
| Average SK hynix PC801 HFS001TEJ9X101N (1335 – 3793, n=8) |
|
| HP EliteBook 845 G10 818N0EA SK hynix PC801 HFS001TEJ9X101N |
|
| HP EliteBook 845 G9 6F6H6EA WDC PC SN810 1TB |
|
| Average of class Office (49 – 3364, n=106, last 2 years) |
|
| Lenovo ThinkPad T14s G3 21CQ002LGE SK Hynix PC711 512GB HFS512GDE9X081N |
|
| Dell Latitude 7440 Samsung MZ9L4512HBLU-00BMV |
|
| Score Write | |
| Average SK hynix PC801 HFS001TEJ9X101N (3831 – 5157, n=8) |
|
| HP EliteBook 845 G10 818N0EA SK hynix PC801 HFS001TEJ9X101N |
|
| SCHENKER Vision 14 2022 RTX 3050 Ti Samsung SSD 980 Pro 1TB MZ-V8P1T0BW |
|
| HP EliteBook 845 G9 6F6H6EA WDC PC SN810 1TB |
|
| Lenovo ThinkPad T14s G3 21CQ002LGE SK Hynix PC711 512GB HFS512GDE9X081N |
|
| Dell Latitude 7440 Samsung MZ9L4512HBLU-00BMV |
|
| Huawei MateBook X Pro 2023 |
|
| Average of class Office (39 – 4111, n=106, last 2 years) |
|
| Seq Read | |
| Average SK hynix PC801 HFS001TEJ9X101N (4270 – 5892, n=8) |
|
| SCHENKER Vision 14 2022 RTX 3050 Ti Samsung SSD 980 Pro 1TB MZ-V8P1T0BW |
|
| HP EliteBook 845 G10 818N0EA SK hynix PC801 HFS001TEJ9X101N |
|
| Huawei MateBook X Pro 2023 |
|
| HP EliteBook 845 G9 6F6H6EA WDC PC SN810 1TB |
|
| Dell Latitude 7440 Samsung MZ9L4512HBLU-00BMV |
|
| Lenovo ThinkPad T14s G3 21CQ002LGE SK Hynix PC711 512GB HFS512GDE9X081N |
|
| Average of class Office (266 – 5739, n=106, last 2 years) |
|
| Seq Write | |
| Average SK hynix PC801 HFS001TEJ9X101N (2808 – 5880, n=8) |
|
| SCHENKER Vision 14 2022 RTX 3050 Ti Samsung SSD 980 Pro 1TB MZ-V8P1T0BW |
|
| Huawei MateBook X Pro 2023 |
|
| HP EliteBook 845 G10 818N0EA SK hynix PC801 HFS001TEJ9X101N |
|
| HP EliteBook 845 G9 6F6H6EA WDC PC SN810 1TB |
|
| Lenovo ThinkPad T14s G3 21CQ002LGE SK Hynix PC711 512GB HFS512GDE9X081N |
|
| Average of class Office (52.2 – 5880, n=106, last 2 years) |
|
| Dell Latitude 7440 Samsung MZ9L4512HBLU-00BMV |
|
| 4K Read | |
| Huawei MateBook X Pro 2023 |
|
| SCHENKER Vision 14 2022 RTX 3050 Ti Samsung SSD 980 Pro 1TB MZ-V8P1T0BW |
|
| Dell Latitude 7440 Samsung MZ9L4512HBLU-00BMV |
|
| Average SK hynix PC801 HFS001TEJ9X101N (58.4 – 79.4, n=8) |
|
| HP EliteBook 845 G10 818N0EA SK hynix PC801 HFS001TEJ9X101N |
|
| Average of class Office (8.89 – 88.1, n=106, last 2 years) |
|
| HP EliteBook 845 G9 6F6H6EA WDC PC SN810 1TB |
|
| Lenovo ThinkPad T14s G3 21CQ002LGE SK Hynix PC711 512GB HFS512GDE9X081N |
|
| 4K Write | |
| Average SK hynix PC801 HFS001TEJ9X101N (152 – 280, n=8) |
|
| Dell Latitude 7440 Samsung MZ9L4512HBLU-00BMV |
|
| SCHENKER Vision 14 2022 RTX 3050 Ti Samsung SSD 980 Pro 1TB MZ-V8P1T0BW |
|
| Huawei MateBook X Pro 2023 |
|
| HP EliteBook 845 G10 818N0EA SK hynix PC801 HFS001TEJ9X101N |
|
| Average of class Office (13.9 – 272, n=106, last 2 years) |
|
| HP EliteBook 845 G9 6F6H6EA WDC PC SN810 1TB |
|
| Lenovo ThinkPad T14s G3 21CQ002LGE SK Hynix PC711 512GB HFS512GDE9X081N |
|
| 4K-64 Read | |
| SCHENKER Vision 14 2022 RTX 3050 Ti Samsung SSD 980 Pro 1TB MZ-V8P1T0BW |
|
| Huawei MateBook X Pro 2023 |
|
| Average SK hynix PC801 HFS001TEJ9X101N (741 – 3131, n=8) |
|
| Average of class Office (13.1 – 2713, n=106, last 2 years) |
|
| HP EliteBook 845 G10 818N0EA SK hynix PC801 HFS001TEJ9X101N |
|
| HP EliteBook 845 G9 6F6H6EA WDC PC SN810 1TB |
|
| Lenovo ThinkPad T14s G3 21CQ002LGE SK Hynix PC711 512GB HFS512GDE9X081N |
|
| Dell Latitude 7440 Samsung MZ9L4512HBLU-00BMV |
|
| 4K-64 Write | |
| Average SK hynix PC801 HFS001TEJ9X101N (3280 – 4381, n=8) |
|
| HP EliteBook 845 G10 818N0EA SK hynix PC801 HFS001TEJ9X101N |
|
| SCHENKER Vision 14 2022 RTX 3050 Ti Samsung SSD 980 Pro 1TB MZ-V8P1T0BW |
|
| HP EliteBook 845 G9 6F6H6EA WDC PC SN810 1TB |
|
| Lenovo ThinkPad T14s G3 21CQ002LGE SK Hynix PC711 512GB HFS512GDE9X081N |
|
| Dell Latitude 7440 Samsung MZ9L4512HBLU-00BMV |
|
| Huawei MateBook X Pro 2023 |
|
| Average of class Office (17.7 – 3394, n=106, last 2 years) |
|
| Access Time Read | |
| Huawei MateBook X Pro 2023 |
|
| Dell Latitude 7440 Samsung MZ9L4512HBLU-00BMV |
|
| Average of class Office (0.022 – 0.389, n=105, last 2 years) |
|
| HP EliteBook 845 G9 6F6H6EA WDC PC SN810 1TB |
|
| Lenovo ThinkPad T14s G3 21CQ002LGE SK Hynix PC711 512GB HFS512GDE9X081N |
|
| Average SK hynix PC801 HFS001TEJ9X101N (0.03 – 0.041, n=8) |
|
| HP EliteBook 845 G10 818N0EA SK hynix PC801 HFS001TEJ9X101N |
|
| SCHENKER Vision 14 2022 RTX 3050 Ti Samsung SSD 980 Pro 1TB MZ-V8P1T0BW |
|
| Access Time Write | |
| Dell Latitude 7440 Samsung MZ9L4512HBLU-00BMV |
|
| Average of class Office (0.017 – 0.717, n=106, last 2 years) |
|
| Average SK hynix PC801 HFS001TEJ9X101N (0.017 – 0.058, n=8) |
|
| Huawei MateBook X Pro 2023 |
|
| Lenovo ThinkPad T14s G3 21CQ002LGE SK Hynix PC711 512GB HFS512GDE9X081N |
|
| HP EliteBook 845 G9 6F6H6EA WDC PC SN810 1TB |
|
| HP EliteBook 845 G10 818N0EA SK hynix PC801 HFS001TEJ9X101N |
|
| SCHENKER Vision 14 2022 RTX 3050 Ti Samsung SSD 980 Pro 1TB MZ-V8P1T0BW |
|
* … smaller is better
Graphics processing is handled by the integrated Radeon 780M. The preview driver from April was still installed on our test device upon delivery, but we installed the new Adrenalin, version 23.7.2, which did not confer any speed advantage. Graphics performance is severely limited by the RAM’s single-channel configuration and so the 780M is unable to unfold its full potential as a result. Consequently, graphics performance is roughly on par with the Iris Xe Graphics G7 from Intel and only slightly ahead of the old Vega 8 from AMD. Users can very easily boost graphics performance with a dual-channel configuration, although this is certainly not a priority for a business laptop. A second RAM bar delivers 65% higher results on average, as already shown in our test of the iGPU. All in all, performance remains almost on the same level as the old Radeon 680M.
GPU performance is not reduced in battery mode and the values remain stable under sustained load. More GPU benchmarks are listed here.
| 3DMark Performance Rating – Percent | |
| SCHENKER Vision 14 2022 RTX 3050 Ti NVIDIA GeForce RTX 3050 Ti Laptop GPU, Intel Core i7-12700H |
|
| HP EliteBook 845 G10 818N0EA AMD Radeon 780M, AMD Ryzen 9 PRO 7940HS |
|
| Average AMD Radeon 780M |
|
| Lenovo ThinkPad T14s G3 21CQ002LGE AMD Radeon 680M, AMD Ryzen 7 PRO 6850U |
|
| Huawei MateBook X Pro 2023 Intel Iris Xe Graphics G7 96EUs, Intel Core i7-1360P |
|
| HP EliteBook 845 G10 818N0EA AMD Radeon 780M, AMD Ryzen 9 PRO 7940HS |
|
| HP EliteBook 845 G9 6F6H6EA AMD Radeon 680M, AMD Ryzen 9 PRO 6950HS |
|
| Dell Latitude 7440 Intel Iris Xe Graphics G7 80EUs, Intel Core i5-1345U |
|
| Average of class Office |
|
| 3DMark 11 – 1280×720 Performance GPU | |
| SCHENKER Vision 14 2022 RTX 3050 Ti NVIDIA GeForce RTX 3050 Ti Laptop GPU, Intel Core i7-12700H |
|
| Average AMD Radeon 780M (7868 – 12978, n=7) |
|
| HP EliteBook 845 G10 818N0EA AMD Radeon 780M, AMD Ryzen 9 PRO 7940HS (Dual-Channel) |
|
| Lenovo ThinkPad T14s G3 21CQ002LGE AMD Radeon 680M, AMD Ryzen 7 PRO 6850U |
|
| HP EliteBook 845 G10 818N0EA AMD Radeon 780M, AMD Ryzen 9 PRO 7940HS |
|
| HP EliteBook 845 G9 6F6H6EA AMD Radeon 680M, AMD Ryzen 9 PRO 6950HS |
|
| Huawei MateBook X Pro 2023 Intel Iris Xe Graphics G7 96EUs, Intel Core i7-1360P |
|
| Dell Latitude 7440 Intel Iris Xe Graphics G7 80EUs, Intel Core i5-1345U |
|
| Average of class Office (599 – 11811, n=121, last 2 years) |
|
| 3DMark | |
| 1920×1080 Fire Strike Graphics | |
| SCHENKER Vision 14 2022 RTX 3050 Ti NVIDIA GeForce RTX 3050 Ti Laptop GPU, Intel Core i7-12700H |
|
| HP EliteBook 845 G10 818N0EA AMD Radeon 780M, AMD Ryzen 9 PRO 7940HS (Dual-Channel) |
|
| Average AMD Radeon 780M (4550 – 7980, n=8) |
|
| Lenovo ThinkPad T14s G3 21CQ002LGE AMD Radeon 680M, AMD Ryzen 7 PRO 6850U |
|
| Huawei MateBook X Pro 2023 Intel Iris Xe Graphics G7 96EUs, Intel Core i7-1360P |
|
| HP EliteBook 845 G10 818N0EA AMD Radeon 780M, AMD Ryzen 9 PRO 7940HS |
|
| Dell Latitude 7440 Intel Iris Xe Graphics G7 80EUs, Intel Core i5-1345U |
|
| HP EliteBook 845 G9 6F6H6EA AMD Radeon 680M, AMD Ryzen 9 PRO 6950HS |
|
| Average of class Office (712 – 7800, n=122, last 2 years) |
|
| 2560×1440 Time Spy Graphics | |
| SCHENKER Vision 14 2022 RTX 3050 Ti NVIDIA GeForce RTX 3050 Ti Laptop GPU, Intel Core i7-12700H |
|
| HP EliteBook 845 G10 818N0EA AMD Radeon 780M, AMD Ryzen 9 PRO 7940HS (Dual-Channel) |
|
| Average AMD Radeon 780M (1496 – 2910, n=8) |
|
| Lenovo ThinkPad T14s G3 21CQ002LGE AMD Radeon 680M, AMD Ryzen 7 PRO 6850U |
|
| Huawei MateBook X Pro 2023 Intel Iris Xe Graphics G7 96EUs, Intel Core i7-1360P |
|
| HP EliteBook 845 G10 818N0EA AMD Radeon 780M, AMD Ryzen 9 PRO 7940HS |
|
| HP EliteBook 845 G9 6F6H6EA AMD Radeon 680M, AMD Ryzen 9 PRO 6950HS |
|
| Dell Latitude 7440 Intel Iris Xe Graphics G7 80EUs, Intel Core i5-1345U |
|
| Average of class Office (242 – 2659, n=119, last 2 years) |
|
| 3DMark 11 Performance | 7732 points | |
| 3DMark Cloud Gate Standard Score | 25056 points | |
| 3DMark Fire Strike Score | 4187 points | |
| 3DMark Time Spy Score | 1707 points | |
|
Help |
||
If you want to play on the EliteBook 845 G10 after work, you should definitely install a second RAM stick because the advantage over the single-channel configuration is a whopping 55% in the gaming benchmarks. Overall, performance values remain comparable to the old Radeon 680M. In practice, this is sufficient for smooth gameplay in 1080p at medium to high details in numerous games. Performance remains constant in battery mode and no performance drops occur during long gaming sessions.
| Performance Rating – Percent | |
| SCHENKER Vision 14 2022 RTX 3050 Ti Intel Core i7-12700H, NVIDIA GeForce RTX 3050 Ti Laptop GPU |
|
| HP EliteBook 845 G10 818N0EA AMD Ryzen 9 PRO 7940HS, AMD Radeon 780M |
|
| Lenovo ThinkPad T14s G3 21CQ002LGE -1! AMD Ryzen 7 PRO 6850U, AMD Radeon 680M |
|
| Huawei MateBook X Pro 2023 Intel Core i7-1360P, Intel Iris Xe Graphics G7 96EUs |
|
| HP EliteBook 845 G9 6F6H6EA AMD Ryzen 9 PRO 6950HS, AMD Radeon 680M |
|
| HP EliteBook 845 G10 818N0EA AMD Ryzen 9 PRO 7940HS, AMD Radeon 780M |
|
| Dell Latitude 7440 Intel Core i5-1345U, Intel Iris Xe Graphics G7 80EUs |
|
| Average of class Office |
|
| The Witcher 3 – 1920×1080 Ultra Graphics & Postprocessing (HBAO+) | |
| SCHENKER Vision 14 2022 RTX 3050 Ti Intel Core i7-12700H, NVIDIA GeForce RTX 3050 Ti Laptop GPU |
|
| Lenovo ThinkPad T14s G3 21CQ002LGE AMD Ryzen 7 PRO 6850U, AMD Radeon 680M |
|
| HP EliteBook 845 G10 818N0EA AMD Ryzen 9 PRO 7940HS, AMD Radeon 780M (Dual-Channel) |
|
| Huawei MateBook X Pro 2023 Intel Core i7-1360P, Intel Iris Xe Graphics G7 96EUs |
|
| HP EliteBook 845 G9 6F6H6EA AMD Ryzen 9 PRO 6950HS, AMD Radeon 680M |
|
| HP EliteBook 845 G10 818N0EA AMD Ryzen 9 PRO 7940HS, AMD Radeon 780M |
|
| Dell Latitude 7440 Intel Core i5-1345U, Intel Iris Xe Graphics G7 80EUs |
|
| Average of class Office (2.44 – 24.5, n=105, last 2 years) |
|
| GTA V – 1920×1080 Highest Settings possible AA:4xMSAA + FX AF:16x | |
| SCHENKER Vision 14 2022 RTX 3050 Ti Intel Core i7-12700H, NVIDIA GeForce RTX 3050 Ti Laptop GPU |
|
| HP EliteBook 845 G10 818N0EA AMD Ryzen 9 PRO 7940HS, AMD Radeon 780M (Dual-Channel) |
|
| HP EliteBook 845 G9 6F6H6EA AMD Ryzen 9 PRO 6950HS, AMD Radeon 680M |
|
| HP EliteBook 845 G10 818N0EA AMD Ryzen 9 PRO 7940HS, AMD Radeon 780M |
|
| Huawei MateBook X Pro 2023 Intel Core i7-1360P, Intel Iris Xe Graphics G7 96EUs |
|
| Average of class Office (3.03 – 33.7, n=84, last 2 years) |
|
| Dell Latitude 7440 Intel Core i5-1345U, Intel Iris Xe Graphics G7 80EUs |
|
| Final Fantasy XV Benchmark – 1920×1080 High Quality | |
| SCHENKER Vision 14 2022 RTX 3050 Ti Intel Core i7-12700H, NVIDIA GeForce RTX 3050 Ti Laptop GPU (1.3) |
|
| HP EliteBook 845 G10 818N0EA AMD Ryzen 9 PRO 7940HS, AMD Radeon 780M (1.3, Dual-Channel) |
|
| Lenovo ThinkPad T14s G3 21CQ002LGE AMD Ryzen 7 PRO 6850U, AMD Radeon 680M (1.3) |
|
| Huawei MateBook X Pro 2023 Intel Core i7-1360P, Intel Iris Xe Graphics G7 96EUs (1.3) |
|
| Dell Latitude 7440 Intel Core i5-1345U, Intel Iris Xe Graphics G7 80EUs (1.3) |
|
| HP EliteBook 845 G10 818N0EA AMD Ryzen 9 PRO 7940HS, AMD Radeon 780M (1.3) |
|
| Average of class Office (2.03 – 26.7, n=91, last 2 years) |
|
| HP EliteBook 845 G9 6F6H6EA AMD Ryzen 9 PRO 6950HS, AMD Radeon 680M (1.3) |
|
| Strange Brigade – 1920×1080 ultra AA:ultra AF:16 | |
| SCHENKER Vision 14 2022 RTX 3050 Ti Intel Core i7-12700H, NVIDIA GeForce RTX 3050 Ti Laptop GPU (1.47.22.14 D3D12) |
|
| HP EliteBook 845 G10 818N0EA AMD Ryzen 9 PRO 7940HS, AMD Radeon 780M (1.47.22.14 D3D12, Dual-Channel) |
|
| Lenovo ThinkPad T14s G3 21CQ002LGE AMD Ryzen 7 PRO 6850U, AMD Radeon 680M (1.47.22.14 D3D12) |
|
| Huawei MateBook X Pro 2023 Intel Core i7-1360P, Intel Iris Xe Graphics G7 96EUs (1.47.22.14 D3D12) |
|
| HP EliteBook 845 G10 818N0EA AMD Ryzen 9 PRO 7940HS, AMD Radeon 780M (1.47.22.14 D3D12) |
|
| HP EliteBook 845 G9 6F6H6EA AMD Ryzen 9 PRO 6950HS, AMD Radeon 680M (1.47.22.14 D3D12) |
|
| Dell Latitude 7440 Intel Core i5-1345U, Intel Iris Xe Graphics G7 80EUs (1.47.22.14 D3D12) |
|
| Average of class Office (6.6 – 45.2, n=88, last 2 years) |
|
| Dota 2 Reborn – 1920×1080 ultra (3/3) best looking | |
| SCHENKER Vision 14 2022 RTX 3050 Ti Intel Core i7-12700H, NVIDIA GeForce RTX 3050 Ti Laptop GPU |
|
| HP EliteBook 845 G10 818N0EA AMD Ryzen 9 PRO 7940HS, AMD Radeon 780M (Dual-Channel) |
|
| Huawei MateBook X Pro 2023 Intel Core i7-1360P, Intel Iris Xe Graphics G7 96EUs |
|
| Lenovo ThinkPad T14s G3 21CQ002LGE AMD Ryzen 7 PRO 6850U, AMD Radeon 680M |
|
| Dell Latitude 7440 Intel Core i5-1345U, Intel Iris Xe Graphics G7 80EUs |
|
| HP EliteBook 845 G10 818N0EA AMD Ryzen 9 PRO 7940HS, AMD Radeon 780M |
|
| HP EliteBook 845 G9 6F6H6EA AMD Ryzen 9 PRO 6950HS, AMD Radeon 680M |
|
| Average of class Office (7.8 – 101.1, n=131, last 2 years) |
|
| X-Plane 11.11 – 1920×1080 high (fps_test=3) | |
| SCHENKER Vision 14 2022 RTX 3050 Ti Intel Core i7-12700H, NVIDIA GeForce RTX 3050 Ti Laptop GPU |
|
| Huawei MateBook X Pro 2023 Intel Core i7-1360P, Intel Iris Xe Graphics G7 96EUs |
|
| HP EliteBook 845 G10 818N0EA AMD Ryzen 9 PRO 7940HS, AMD Radeon 780M (Dual-Channel) |
|
| Lenovo ThinkPad T14s G3 21CQ002LGE AMD Ryzen 7 PRO 6850U, AMD Radeon 680M |
|
| HP EliteBook 845 G9 6F6H6EA AMD Ryzen 9 PRO 6950HS, AMD Radeon 680M |
|
| HP EliteBook 845 G10 818N0EA AMD Ryzen 9 PRO 7940HS, AMD Radeon 780M |
|
| Average of class Office (5.55 – 73.4, n=128, last 2 years) |
|
| Dell Latitude 7440 Intel Core i5-1345U, Intel Iris Xe Graphics G7 80EUs |
|
| The Witcher 3 – 1920×1080 Ultra Graphics & Postprocessing (HBAO+) | |
| SCHENKER Vision 14 2022 RTX 3050 Ti Intel Core i7-12700H, NVIDIA GeForce RTX 3050 Ti Laptop GPU |
|
| Average AMD Radeon 780M (14.3 – 31.5, n=6) |
|
| Lenovo ThinkPad T14s G3 21CQ002LGE AMD Ryzen 7 PRO 6850U, AMD Radeon 680M |
|
| HP EliteBook 845 G10 818N0EA AMD Ryzen 9 PRO 7940HS, AMD Radeon 780M (Dual-Channel) |
|
| Huawei MateBook X Pro 2023 Intel Core i7-1360P, Intel Iris Xe Graphics G7 96EUs |
|
| HP EliteBook 845 G9 6F6H6EA AMD Ryzen 9 PRO 6950HS, AMD Radeon 680M |
|
| HP EliteBook 845 G10 818N0EA AMD Ryzen 9 PRO 7940HS, AMD Radeon 780M |
|
| Dell Latitude 7440 Intel Core i5-1345U, Intel Iris Xe Graphics G7 80EUs |
|
| Average of class Office (2.44 – 24.5, n=105, last 2 years) |
|
| F1 22 – 1920×1080 High Preset AA:T AF:16x | |
| SCHENKER Vision 14 2022 RTX 3050 Ti Intel Core i7-12700H, NVIDIA GeForce RTX 3050 Ti Laptop GPU (923650) |
|
| Average AMD Radeon 780M (31.7 – 66.3, n=6) |
|
| HP EliteBook 845 G10 818N0EA AMD Ryzen 9 PRO 7940HS, AMD Radeon 780M (Dual-Channel) |
|
| Huawei MateBook X Pro 2023 Intel Core i7-1360P, Intel Iris Xe Graphics G7 96EUs (959964) |
|
| HP EliteBook 845 G10 818N0EA AMD Ryzen 9 PRO 7940HS, AMD Radeon 780M (959964) |
|
| Average of class Office (9.78 – 52, n=24, last 2 years) |
|
| Dell Latitude 7440 Intel Core i5-1345U, Intel Iris Xe Graphics G7 80EUs (959964) |
|
| Far Cry 5 – 1920×1080 High Preset AA:T | |
| SCHENKER Vision 14 2022 RTX 3050 Ti Intel Core i7-12700H, NVIDIA GeForce RTX 3050 Ti Laptop GPU |
|
| HP EliteBook 845 G10 818N0EA AMD Ryzen 9 PRO 7940HS, AMD Radeon 780M (Dual-Channel) |
|
| Average AMD Radeon 780M (22 – 41, n=5) |
|
| Huawei MateBook X Pro 2023 Intel Core i7-1360P, Intel Iris Xe Graphics G7 96EUs |
|
| HP EliteBook 845 G10 818N0EA AMD Ryzen 9 PRO 7940HS, AMD Radeon 780M |
|
| Average of class Office (1 – 36, n=35, last 2 years) |
|
| HP EliteBook 845 G9 6F6H6EA AMD Ryzen 9 PRO 6950HS, AMD Radeon 680M |
|
| Cyberpunk 2077 1.5 – 1920×1080 High Preset | |
| SCHENKER Vision 14 2022 RTX 3050 Ti Intel Core i7-12700H, NVIDIA GeForce RTX 3050 Ti Laptop GPU |
|
| Average AMD Radeon 780M (12 – 30.5, n=5) |
|
| HP EliteBook 845 G10 818N0EA AMD Ryzen 9 PRO 7940HS, AMD Radeon 780M (Dual-Channel) |
|
| Average of class Office (8.9 – 20, n=11, last 2 years) |
|
| HP EliteBook 845 G10 818N0EA AMD Ryzen 9 PRO 7940HS, AMD Radeon 780M |
|
| Dell Latitude 7440 Intel Core i5-1345U, Intel Iris Xe Graphics G7 80EUs |
|
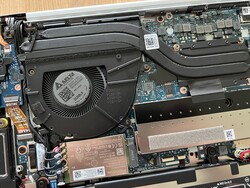
Probably the biggest weakness of the EliteBook 845 G10 is the single fan and 35-watt processor combination. When idle, the latter is almost always deactivated, but even light tasks cause the fan to fire up too quickly. This also applies to the most efficient performance mode, since the CPU can still consume 35 watts here. Fan noise increases quite quickly to 43 dB(A) under load, which is clearly audible. Furthermore, the fan speed always pulsates a bit, which sounds restless and can be annoying in the long run. Again, we believe that models with a U-series processor perform better in everyday use. Otherwise, no other electronic noises were heard in our test device.
Noise Level
| Idle |
25.3 / 25.3 / 25.3 dB(A) |
|
| Load | 34.4 / 43.4 dB(A) | |
 |
||
|
30 dB 40 dB(A) 50 dB(A) |
||
|
min: |
||
| HP EliteBook 845 G10 818N0EA Radeon 780M, R9 PRO 7940HS, SK hynix PC801 HFS001TEJ9X101N |
Lenovo ThinkPad T14s G3 21CQ002LGE Radeon 680M, R7 PRO 6850U, SK Hynix PC711 512GB HFS512GDE9X081N |
Dell Latitude 7440 Iris Xe G7 80EUs, i5-1345U, Samsung MZ9L4512HBLU-00BMV |
Huawei MateBook X Pro 2023 Iris Xe G7 96EUs, i7-1360P |
SCHENKER Vision 14 2022 RTX 3050 Ti GeForce RTX 3050 Ti Laptop GPU, i7-12700H, Samsung SSD 980 Pro 1TB MZ-V8P1T0BW |
HP EliteBook 845 G9 6F6H6EA Radeon 680M, R9 PRO 6950HS, WDC PC SN810 1TB |
|
|---|---|---|---|---|---|---|
| Noise |
21% |
15% |
-6% |
-7% |
-3% |
|
| off / environment * |
25.3 |
22.8 10% |
22.8 10% |
25.4 -0% |
24.4 4% |
25.5 -1% |
| Idle Minimum * |
25.3 |
22.8 10% |
22.8 10% |
25.4 -0% |
24.4 4% |
25.5 -1% |
| Idle Average * |
25.3 |
22.8 10% |
22.8 10% |
25.4 -0% |
24.4 4% |
25.5 -1% |
| Idle Maximum * |
25.3 |
22.8 10% |
22.8 10% |
29.6 -17% |
27.8 -10% |
25.5 -1% |
| Load Average * |
34.4 |
22.8 34% |
26.3 24% |
42 -22% |
43.3 -26% |
38.1 -11% |
| Witcher 3 ultra * |
43.4 |
27.5 37% |
30 31% |
48.2 -11% |
||
| Load Maximum * |
43.4 |
27.3 37% |
38.3 12% |
40.9 6% |
48.8 -12% |
44 -1% |
* … smaller is better
No issues of temperature arise in everyday use, but if you stress the processor for long periods of time, the central rear area on the underside heats up significantly and we measure temperatures of more than 50 °C here. Due to the single fan, the left side of the case also gets noticeably warmer. This is also apparent when typing under load, but there are no restrictions here. The CPU quickly settles at a consumption of 41 watts and remains constant at this level.
|
|||||||||||||||||||||||||
| Maximum: 45.6 °C=114 F Average: 39.2 °C=103 F |
|||||||||||||||||||||||||
|
|||||||||||||||||||||||||
| Maximum: 51.9 °C=125 F Average: 41.2 °C=106 F |
|||||||||||||||||||||||||
Power Supply (max.) 46.3 °C=115 F | Room Temperature 22 °C=72 F | Fluke t3000FC (calibrated), Voltcraft IR-900
(-) The average temperature for the upper side under maximal load is 39.2 °C / 103 F, compared to the average of 29.5 °C / 85 F for the devices in the class Office.
(-) The maximum temperature on the upper side is 45.6 °C / 114 F, compared to the average of 34.2 °C / 94 F, ranging from 21.2 to 62.5 °C for the class Office.
(-) The bottom heats up to a maximum of 51.9 °C / 125 F, compared to the average of 36.7 °C / 98 F
(+) In idle usage, the average temperature for the upper side is 25.8 °C / 78 F, compared to the device average of 29.5 °C / 85 F.
(±) Playing The Witcher 3, the average temperature for the upper side is 37 °C / 99 F, compared to the device average of 29.5 °C / 85 F.
(±) The palmrests and touchpad can get very hot to the touch with a maximum of 36.2 °C / 97.2 F.
(-) The average temperature of the palmrest area of similar devices was 27.8 °C / 82 F (-8.4 °C / -15.2 F).
The two stereo speakers can get very loud and deliver very good quality overall, especially for a business computer. The two modules only lack vigor, which is why we recommend headphones or external speakers for louder music and films. Speech intelligibility, such as during conferences, is very good.
Frequency diagram (checkboxes can be checked and unchecked to compare devices)
HP EliteBook 845 G10 818N0EA audio analysis
(+) | speakers can play relatively loud (83.2 dB)
Bass 100 – 315 Hz
(-) | nearly no bass – on average 19.5% lower than median
(±) | linearity of bass is average (13.3% delta to prev. frequency)
Mids 400 – 2000 Hz
(+) | balanced mids – only 3.4% away from median
(+) | mids are linear (2.5% delta to prev. frequency)
Highs 2 – 16 kHz
(+) | balanced highs – only 2.2% away from median
(+) | highs are linear (3.6% delta to prev. frequency)
Overall 100 – 16.000 Hz
(+) | overall sound is linear (14.2% difference to median)
Compared to same class
» 7% of all tested devices in this class were better, 3% similar, 90% worse
» The best had a delta of 7%, average was 22%, worst was 53%
Compared to all devices tested
» 12% of all tested devices were better, 3% similar, 85% worse
» The best had a delta of 4%, average was 26%, worst was 134%
Huawei MateBook X Pro 2023 audio analysis
(+) | speakers can play relatively loud (94 dB)
Bass 100 – 315 Hz
(±) | reduced bass – on average 9.2% lower than median
(+) | bass is linear (4.9% delta to prev. frequency)
Mids 400 – 2000 Hz
(+) | balanced mids – only 1.8% away from median
(+) | mids are linear (3.7% delta to prev. frequency)
Highs 2 – 16 kHz
(±) | higher highs – on average 6.5% higher than median
(±) | linearity of highs is average (8.1% delta to prev. frequency)
Overall 100 – 16.000 Hz
(+) | overall sound is linear (10.3% difference to median)
Compared to same class
» 4% of all tested devices in this class were better, 2% similar, 94% worse
» The best had a delta of 5%, average was 20%, worst was 53%
Compared to all devices tested
» 3% of all tested devices were better, 1% similar, 96% worse
» The best had a delta of 4%, average was 26%, worst was 134%
The EliteBook 845 G10 with the 120 Hz display is more economical than the SureView display, but also consumes more power than the low-power 1080p panel. It becomes somewhat problematic under load because the 65 watt power supply constantly reaches its limit due to the high power limit and is unable to charge the battery in this scenario. A 90-watt power supply would have been a better choice for the HS processor.
| HP EliteBook 845 G10 818N0EA R9 PRO 7940HS, Radeon 780M, SK hynix PC801 HFS001TEJ9X101N, IPS, 2560×1600, 14.00 |
Lenovo ThinkPad T14s G3 21CQ002LGE R7 PRO 6850U, Radeon 680M, SK Hynix PC711 512GB HFS512GDE9X081N, LTPS IPS LED, 1920×1200, 14.00 |
Dell Latitude 7440 i5-1345U, Iris Xe G7 80EUs, Samsung MZ9L4512HBLU-00BMV, IPS, 2560×1600, 14.00 |
Huawei MateBook X Pro 2023 i7-1360P, Iris Xe G7 96EUs, , IPS, 3120×2080, 14.20 |
SCHENKER Vision 14 2022 RTX 3050 Ti i7-12700H, GeForce RTX 3050 Ti Laptop GPU, Samsung SSD 980 Pro 1TB MZ-V8P1T0BW, IPS, 2880×1800, 14.00 |
HP EliteBook 845 G9 6F6H6EA R9 PRO 6950HS, Radeon 680M, WDC PC SN810 1TB, IPS, 1920×1200, 14.00 |
Average AMD Radeon 780M |
Average of class Office |
|
|---|---|---|---|---|---|---|---|---|
| Power Consumption |
44% |
19% |
8% |
-38% |
-23% |
-1% |
20% |
|
| Idle Minimum * |
4.3 |
2.2 49% |
4.5 -5% |
4.1 5% |
7.5 -74% |
6.4 -49% |
5.12 {el.classList.toggle(‘hideEl’);});return false;”>?(4.2 – 7.01, n=5) -19% |
4.25 {el.classList.toggle(‘hideEl’);});return false;”>?(2.2 – 8.6, n=107, last 2 years) 1% |
| Idle Average * |
10.1 |
4.4 56% |
6.5 36% |
6.6 35% |
10.4 -3% |
12.4 -23% |
7.18 {el.classList.toggle(‘hideEl’);});return false;”>?(5.8 – 10.1, n=5) 29% |
7.45 {el.classList.toggle(‘hideEl’);});return false;”>?(3.8 – 20.6, n=107, last 2 years) 26% |
| Idle Maximum * |
11.2 |
5.1 54% |
7.3 35% |
8 29% |
11.4 -2% |
18 -61% |
9.62 {el.classList.toggle(‘hideEl’);});return false;”>?(6.3 – 12.3, n=5) 14% |
9.17 {el.classList.toggle(‘hideEl’);});return false;”>?(4.7 – 23.9, n=107, last 2 years) 18% |
| Load Average * |
64.4 |
33.3 48% |
52.5 18% |
61 5% |
83.3 -29% |
63 2% |
66 {el.classList.toggle(‘hideEl’);});return false;”>?(56.6 – 72.5, n=4) -2% |
38.3 {el.classList.toggle(‘hideEl’);});return false;”>?(8.2 – 64.5, n=107, last 2 years) 41% |
| Witcher 3 ultra * |
59.4 |
40.1 32% |
46.2 22% |
56 6% |
92.7 -56% |
63.6 -7% |
||
| Load Maximum * |
66.7 |
48.5 27% |
63 6% |
90 -35% |
110.3 -65% |
68 -2% |
85.1 {el.classList.toggle(‘hideEl’);});return false;”>?(66.7 – 111.8, n=4) -28% |
57 {el.classList.toggle(‘hideEl’);});return false;”>?(8.7 – 107.9, n=107, last 2 years) 15% |
* … smaller is better
HP installs a relatively small, 51 Wh battery that, together with the high-resolution panel, only allows for average runtimes. At a brightness of 150 cd/m² (corresponding to 45% of the maximum brightness in our test device), our video test runs for just over 9 hours and the WLAN test for almost 8 hours. In contrast, the WLAN test at maximum brightness lasted a little more than 5 hours. If you find this insufficient, you should choose a configuration with the low-power display. A full charge with the device switched on takes 2 hours, but 50% of the capacity is already available after about 34 minutes.
Battery Runtime
| WiFi Websurfing (Edge 115) | 7h 51min | |
| WiFi Websurfing max. Brightness (Edge 115) | 5h 10min | |
| Big Buck Bunny H.264 1080p | 9h 17min | |
| Load (maximum brightness) | 0h 56min |
| HP EliteBook 845 G10 818N0EA R9 PRO 7940HS, Radeon 780M, 51 Wh |
Lenovo ThinkPad T14s G3 21CQ002LGE R7 PRO 6850U, Radeon 680M, 57 Wh |
Dell Latitude 7440 i5-1345U, Iris Xe G7 80EUs, 57 Wh |
Huawei MateBook X Pro 2023 i7-1360P, Iris Xe G7 96EUs, 60 Wh |
SCHENKER Vision 14 2022 RTX 3050 Ti i7-12700H, GeForce RTX 3050 Ti Laptop GPU, 99.8 Wh |
HP EliteBook 845 G9 6F6H6EA R9 PRO 6950HS, Radeon 680M, 51 Wh |
Average of class Office |
|
|---|---|---|---|---|---|---|---|
| Battery Runtime |
108% |
130% |
46% |
57% |
30% |
54% |
|
| H.264 |
557 |
527 -5% |
666 20% |
685 {el.classList.toggle(‘hideEl’);});return false;”>?(348 – 1112, n=36, last 2 years) 23% |
|||
| WiFi v1.3 |
471 |
718 52% |
781 66% |
580 23% |
607 29% |
560 19% |
584 {el.classList.toggle(‘hideEl’);});return false;”>?(272 – 1715, n=107, last 2 years) 24% |
| Load |
56 |
148 164% |
164 193% |
124 121% |
124 121% |
79 41% |
120.8 {el.classList.toggle(‘hideEl’);});return false;”>?(56 – 285, n=57, last 2 years) 116% |
| Reader / Idle |
1427 |
1292 |
1356 {el.classList.toggle(‘hideEl’);});return false;”>?(483 – 2359, n=28, last 2 years) |
Pros
+ stable and high-quality case
+ 120 Hz display with P3 color space
+ very high CPU performance
+ very good keyboard
+ 5G module integrated, USB 4
+ good maintenance options
+ 5MP webcam
Cons
– test device only has single-channel RAM
– fan fires up quickly
– no SD card reader
– high-resolution display reduces battery life
– marginally sized power supply
The EliteBook 845 G10 is not HP’s flagship business notebook (but rather the EliteBook 1040 G10; review will follow shortly), but it is certainly one of the best business devices at the moment thanks to its fast AMD processor, sturdy aluminum case and excellent keyboard. Apart from the slightly more flexible display lid, the workmanship is very good and the CPU performance high. Theoretically, the laptop has a clear advantage over the Intel competition in terms of graphics performance, but this advantage is canceled out in our test device due to the RAM’s single-channel configuration. We don’t think many EliteBook customers will need more than 32GB of RAM, so a 2x 16GB configuration would certainly make more sense for the vast majority of customers.
Other advantages include the extensive security features, the good maintenance options, the large selection of ports (including USB 4), and the extensive service and warranty options. The EliteBook doesn’t have to shy away when it comes to the display either because the high-resolution 120 Hz screen offers great image quality without PWM flickering and is also very well calibrated ex works. However, the panel also requires more power than the regular 1080p version with 400 cd/m².
HP gets a lot right in the EliteBook 845 G10 and offers the best business notebook with an AMD processor and, at the same time, one of the best business models ever.
The CPU performance of the new Ryzen 9 Pro 7940HS is very solid and stable, but we believe that models with the U-series chips (e.g. the Ryzen 7 Pro 7840U) would be the better choice for the EliteBook 845 G10 in view of the cooling and the overactive fan.
Although our test device is one of the most expensive models, the cheaper versions of the EliteBook 845 G10 are also an interesting alternative thanks to the modern AMD processors. The model with the Ryzen Pro 5 and the LowPower 1080p display is already available for just over EUR 1,000 and the models with the 7840U start at around EUR 1,500 (these models do not appear to be available in the US at present). However, we would advise against the optional SureView display.
Among the competition, we’re especially curious about the new ThinkPad T14s G4, and we’ll also be looking at the more expensive EliteBook 1040 G4 shortly. If you need more graphics power, you should take a look at the Schenker Vision 14 with its RTX 3050 Ti.
The base version of the EliteBook 845 G10 is priced at US$2,007.00 in HP’s US webstore. Users have numerous configuration options, such as the processor, RAM and display, among other things.
HP EliteBook 845 G10 818N0EA
–
08/14/2023 v7
Andreas Osthoff
Connectivity
69 / 80 → 86%
Games Performance
63 / 78 → 80%
Application Performance
95 / 95 → 100%
Office – Weighted Average
More articles related to this device
HP EliteBook 845 G10 818N0EA (EliteBook 845 G10 Series)
Transparency
The present review sample was made available to the author as a loan by the manufacturer or a shop for the purposes of review. The lender had no influence on this review, nor did the manufacturer receive a copy of this review before publication. There was no obligation to publish this review.
Pricecompare

Editor of the original article: Andreas Osthoff – Managing Editor Business Laptops – 1517 articles published on Notebookcheck since 2013
I grew up with modern consumer electronics and my first computer was a Commodore C64, which encouraged my interest in building my own systems. I started working as a review editor for Notebookcheck during my dual studies at Siemens. Currently, I am mainly responsible for dealing with business laptops and mobile workstations. It’s a great experience to be able to review the latest devices and technologies and then compare them with each other.

Translator: Jacob Fisher – Translator – 244 articles published on Notebookcheck since 2022
Growing up in regional Australia, I first became acquainted with computers in my early teens after a broken leg from a football (soccer) match temporarily condemned me to a predominately indoor lifestyle. Soon afterwards I was building my own systems. Now I live in Germany, having moved here in 2014, where I study philosophy and anthropology. I am particularly fascinated by how computer technology has fundamentally and dramatically reshaped human culture, and how it continues to do so.
Andreas Osthoff, 2023-08-15 (Update: 2023-08-15)