- David Gadsden, a geographer with more than two decades of experience applying geospatial technology to address complex humanitarian and conservation challenges, argues that the “30 by 30” conservation target could catalyze progress on a range of challenging issues.
- Progress will be enabled and accelerated by new mapping tools and technologies that are increasing the accessibility and utility of geospatial data that informs decision-making in protecting and restoring ecosystems.
- “There is so much data now — from sensors, from satellites, from commercial operations — that many questions about impact that could hardly be asked 20 years ago can now be answered with a few clicks And all that data can be layered onto the same map, so everyone with an interest is working from the same framework,” writes Gadsden. “Tools that used to be highly specialized — exclusively in the hands of data professionals — are now instantly available. They’re democratizing.”
- This post is a commentary. The views expressed are those of the authors, not necessarily of Mongabay.
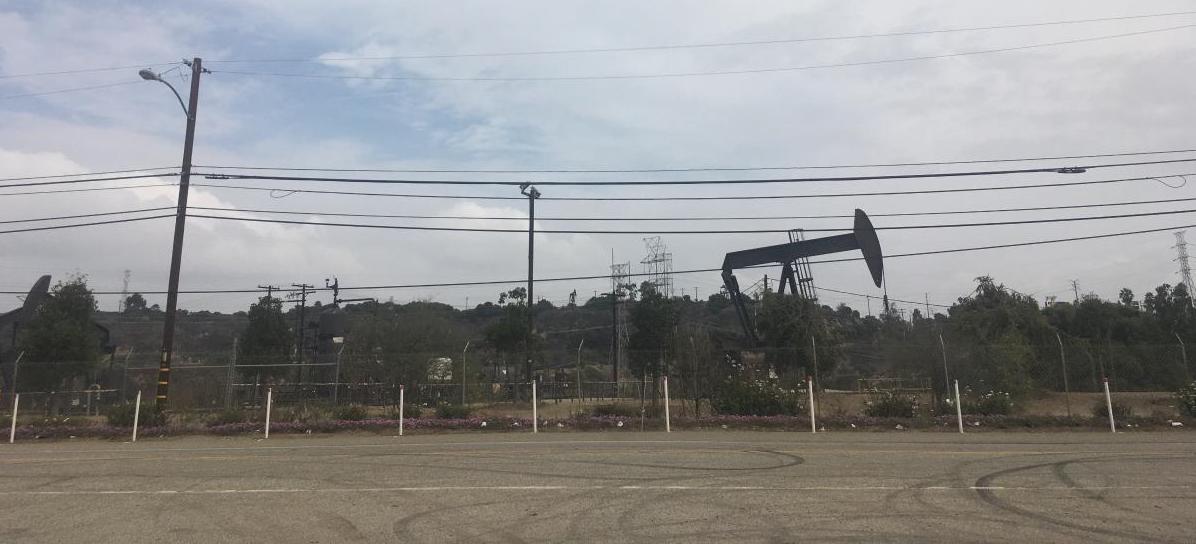
In South Los Angeles — right in the heart of the 10-million-person metro area — sits a sprawling 1,000-acre zone from another era: It’s the Inglewood Oil Field, a rolling scrubland dotted with hundreds of working oil pump jacks.
La Cienega Boulevard cuts right through the oil field, which is just northeast of LAX, and just eight miles east of Venice Beach.
The production of oil from 444 wells in the heart of Los Angeles feels increasingly off brand for what aspires to be a progressive city (California has banned sale of new gas-powered cars starting in 2035). Not surprisingly two municipalities where the Inglewood Oil Field is located — Los Angeles and Culver City — have both ordered the oil wells shut down and capped over the next decade.
Which presents a remarkable opportunity: The chance to restore the Inglewood Oil Field from a century-old industrial zone — oil has been pumped there since 1924 — into a natural area for both recreational benefit and increasing space for nature in this sprawling urban landscape. As it happens, there’s already a natural area nearby: Along Inglewood’s northeastern border sits the Kenneth Hahn State Recreation Area.
Hahn is 400 acres of hiking trails, woodlands, hilly scrub. Restoring the adjacent land from the oil field would more than triple its size.
One million people live within five miles of the oil field. If it becomes parkland, those one million people will suddenly live within five miles of an urban wildland larger than New York City’s Central Park.
That’s exactly the kind of thoughtful remediation that could help advance efforts to restore the landscape of the United States — and the world — and also change our attitude about land use and nature in the process. The effort might even change how we fight about land use, something Americans have been doing for hundreds of years.

The effort is called “30 by 30,” pronounced “thirty-by-thirty.”
It’s a simple tag for a dramatic — perhaps even a radical — re-imagining of people in the landscape.
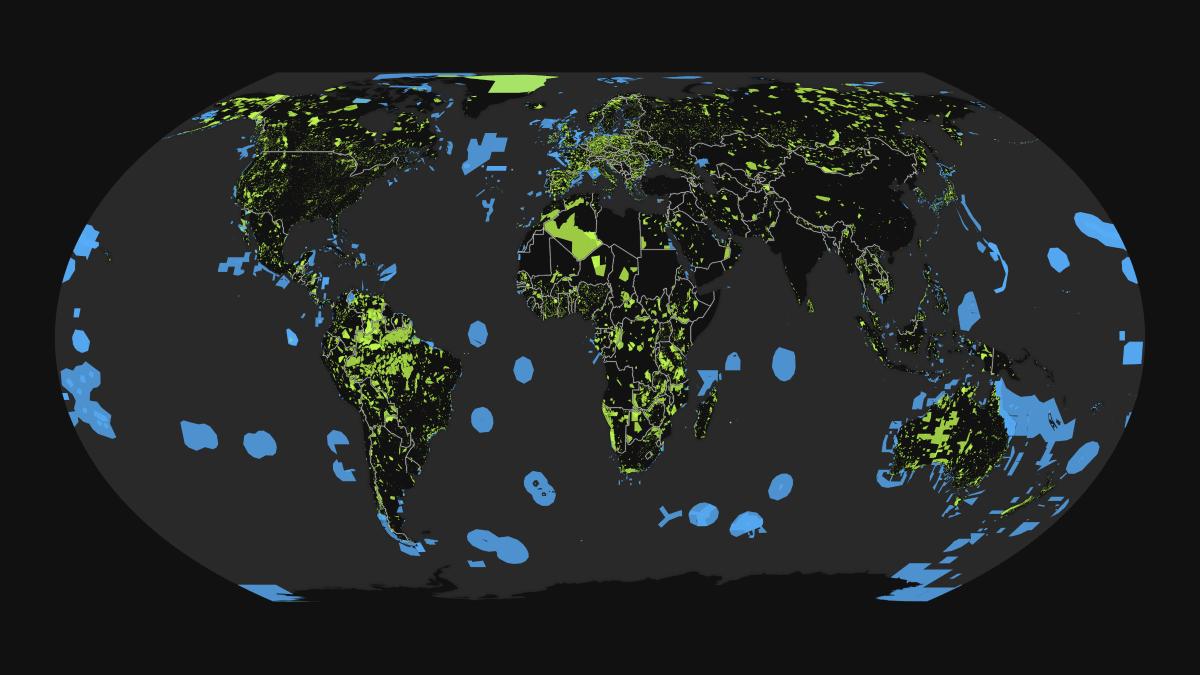
“30 by 30” is shorthand for a concerted effort to preserve, and conserve, 30 percent of the land and 30 percent of the water in the United States, and across the planet, by 2030.
“30 by 30” – 30 percent of Earth protected by 2030.
The goal itself is radical, although not quite as radical as it seems. In the United States, 12 percent of land is already protected, and 26 percent of coastal waters.
Around the world, almost 200 countries have committed to “30 by 30” under the newly ratified UN Convention on Biological Diversity. In the United States, President Joe Biden issued an executive order committing to working towards “30 by 30” on January 27, 2021, seven days after taking office.
Beyond the stretch of more than doubling the amount of U.S. land that is protected in less than a decade, “30 by 30” aims to change two long-entrenched ideas that can make widening land conservation hard.

The first is to change the definition of what “protected land” means — to move from a traditional, Yellowstone National Park idea of “fortress conservation,” where there’s a hard boundary between what’s protected and what’s not – to a more nimble and adaptable idea of “functional conservation.” Wide swaths of land — rangeland in the west, farmland across the Plains and Midwest, hunting preserves everywhere — can be used for both productive human purposes and conserving biological diversity, if that land is managed more thoughtfully to accommodate nature, with regard to water use, for instance, or managing agricultural activities around bird and animal migration patterns.
And the second dramatic change “30 by 30” could help usher in is a wholesale transformation of how conservation decisions get made, and how people navigate the traditional tension between “development” (think subdivisions, office parks, shopping centers) and “conservation” (think national parks).
If all conservation means is putting land behind a border that preserves it exclusively, there will always be battles about what’s “lost” by taking that land out of any human use beyond recreation; and if land that is traditionally considered not protected can be adapted to conservation uses — without surrendering everything people use it for — that makes conversations about conservation easier.
Fresh tools — especially sophisticated interactive maps — are one of the key elements that make conservationists, policymakers and even businesspeople and farmers think that “30 by 30” might be possible. And those maps are powering a fresh approach to inclusively exploring approaches to conservation, especially in the U.S.

California is far ahead of much of the rest of the U.S. in pursuing “30 by 30.” For one thing, 24 percent of California’s land is already protected in some capacity.
Gov. Gavin Newsom first issued an executive order aiming the state at the 30 percent goal in October 2020 — before Biden was elected president — and California’s conservation agency has followed up with a remarkable map that catalogs all of California’s land, based on its land use, including every protected area in the state.
The maps, which are available online and are interactive, go much further, though: They layer on information about biodiversity, climate impact, public access, racial and socio-economic diversity.
Because the goal of “30 by 30” isn’t just to draw enough lines to “set aside” 30 percent of land. It’s to find the land and water that can have the most impact on the real goal — to preserve or even improve biodiversity; to reduce the pace of climate change, and also the impact of climate change on people and nature; and to give historically disadvantaged communities — who have much less access to green space across the nation — improved access to parks and outdoor recreation.
It’s a technique called “data-driven conservation” — don’t just pick some land that’s convenient, or affordable, or available, and protect that. Pick the places that provide maximum impact for nature and to best extend the power of nature to advance human well being.
The mapping tools don’t just allow users — professionals, developers, regulators, and also ordinary people — to see what’s protected, and how. It allows people to test out alternative scenarios. As the Inglewood Oil Field gradually shuts down, that 1,000 acres could be maintained in some other commercial or industrial use. Or all 1,000 acres could be completely protected and restored to a wild state.
But maybe the cost of either of those all-or-nothing options is too high — the area is too valuable as a natural habitat not to restore some of it; the land itself is too valuable to Los Angeles residents not to allow some human use. Then you’re arguing about how to balance the two. California’s new mapping tools allow you to construct, say, four different cases — where parts of the area with the most conservation impact are preserved, where the parts that could be converted to new human uses get developed.
And then the impact of each of those possibilities — perhaps this slice of land along bustling La Cienega Boulevard becomes commercial, this chunk adjacent to Hahn State Recreation area is restored — can be assessed.
That changes the conversation — about individual parcels, and tough spots, the places where businesspeople are eager to develop right at the edge of beautiful natural lands, or where conservationists want to reclaim developed areas. Do those changes make sense — for the human economy? For the natural economy? For social equity? What are the actual tradeoffs — backed by data?

It’s a new kind of geographic approach that also allows a smarter look at wider arenas, and bigger questions. For instance, how should California think about “30 by 30,” and the state’s devastating wildfire risk, and the need to increase affordable housing — all at the same time? How can those three priorities — perhaps — inform each other, rather than being seen as battling each other?
There is so much data now — from sensors, from satellites, from commercial operations — that many questions about impact that could hardly be asked 20 years ago can now be answered with a few clicks. And all that data can be layered onto the same map, so everyone with an interest is working from the same framework. Tools that used to be highly specialized — exclusively in the hands of data professionals — are now instantly available. They’re democratizing.
The risks — from climate, from pollution, from flooding, or from housing that’s too expensive, or not dense enough, or too close to wildfire zones — those risks, and those opportunities, are all in the images, in the data. And so on the maps.
The U.S. Geological Survey and other Agencies are in the process of developing the same kind of map — or layers of maps — for the America the Beautiful initiative much like California has developed for its own “30 by 30” effort.
Despite the boldness inherent in “30 by 30,” Americans support it with a unity rare among any issues — 62 percent of Americans polled are in favor of the “30 by 30” goal, including 52 percent of rural residents and 64 percent of those who live in the West. And that’s all without the campaign getting much visibility.
“30 by 30” only got started in 2016. It has gained astonishing momentum in just a few years in part because of the clarity and simplicity of the idea, a policy that is its own slogan. And it has momentum because people everywhere suddenly realize that nature isn’t a luxury. Nature isn’t a tradeoff with human success, or an impediment to it. The only way to have a varied, thriving, secure human society is for it to be set within a varied, thriving, and secure natural ecosystem.
Author: David Gadsden is a geographer for the digital mapping company Esri. He has more than two decades of experience applying geospatial technology to address complex humanitarian and conservation challenges.


