
- A cheerful market mood has strengthened the Australian Dollar.
- North-side sloping 20-and 50-EMAs add to the upside filters.
- The RSI (14) has shifted into the bullish range of 60.00-80.00, which indicates that bullish momentum is active now.
The AUD/USD pair is displaying a sideways auction around the immediate hurdle of 0.6930 in the Asian session. The Aussie asset is expected to continue its upside journey amid sheer volatility in the US Dollar Index (DXY). The USD Index has dropped below 103.25, at the time of writing, and is expected to refresh its six-month low below the critical support of 103.00 amid a risk-appetite theme.
S&P500 futures have carry-forwarded Friday’s strength as investors see a slowdown in the policy tightening pace by the Federal Reserve (Fed) ahead. Meanwhile, the 10-year US Treasury yields dropped to 3.56%.
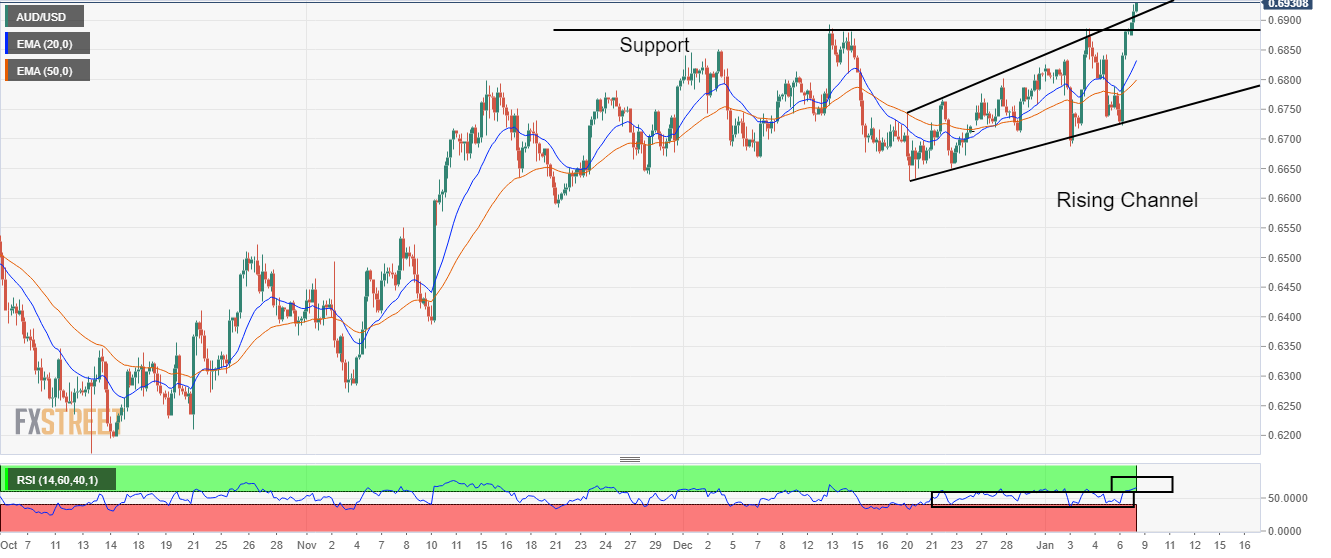
On a four-hour scale, the Aussie asset has delivered an upside break of the horizontal resistance plotted from December 13 high around 0.6880, which has turned into support now. Also, the breakout of the Rising Channel chart pattern indicates the strength of the Australian Dollar.
Upward-sloping 20-and 50-period Exponential Moving Averages (EMAs) at 0.6833 and 0.6800 respectively add to the upside filters.
Also, the Relative Strength Index (RSI) (14) has delivered a breakout into the bullish range of 60.00-80.00, which indicates that the upside momentum has been triggered.
After a juggernaut rally, a corrective to near December 13 high around 0.6880 would be an optimal buy for investors, which will drive the major towards Monday’s high at 0.6930, followed by the psychological resistance at 0.7000.
On the contrary, a downside move below December 29 low at 0.6710 will drag the major further toward December 22 low at 0.6650 followed by November 21 low at 0.6585.
AUD/USD four-hour chart
Information on these pages contains forward-looking statements that involve risks and uncertainties. Markets and instruments profiled on this page are for informational purposes only and should not in any way come across as a recommendation to buy or sell in these assets. You should do your own thorough research before making any investment decisions. FXStreet does not in any way guarantee that this information is free from mistakes, errors, or material misstatements. It also does not guarantee that this information is of a timely nature. Investing in Open Markets involves a great deal of risk, including the loss of all or a portion of your investment, as well as emotional distress. All risks, losses and costs associated with investing, including total loss of principal, are your responsibility. The views and opinions expressed in this article are those of the authors and do not necessarily reflect the official policy or position of FXStreet nor its advertisers. The author will not be held responsible for information that is found at the end of links posted on this page.
If not otherwise explicitly mentioned in the body of the article, at the time of writing, the author has no position in any stock mentioned in this article and no business relationship with any company mentioned. The author has not received compensation for writing this article, other than from FXStreet.
FXStreet and the author do not provide personalized recommendations. The author makes no representations as to the accuracy, completeness, or suitability of this information. FXStreet and the author will not be liable for any errors, omissions or any losses, injuries or damages arising from this information and its display or use. Errors and omissions excepted.
The author and FXStreet are not registered investment advisors and nothing in this article is intended to be investment advice.