Ripple’s price has been gradually declining over the past few days, and the situation does not look promising for XRP at the moment.
Technical Analysis
By Edris
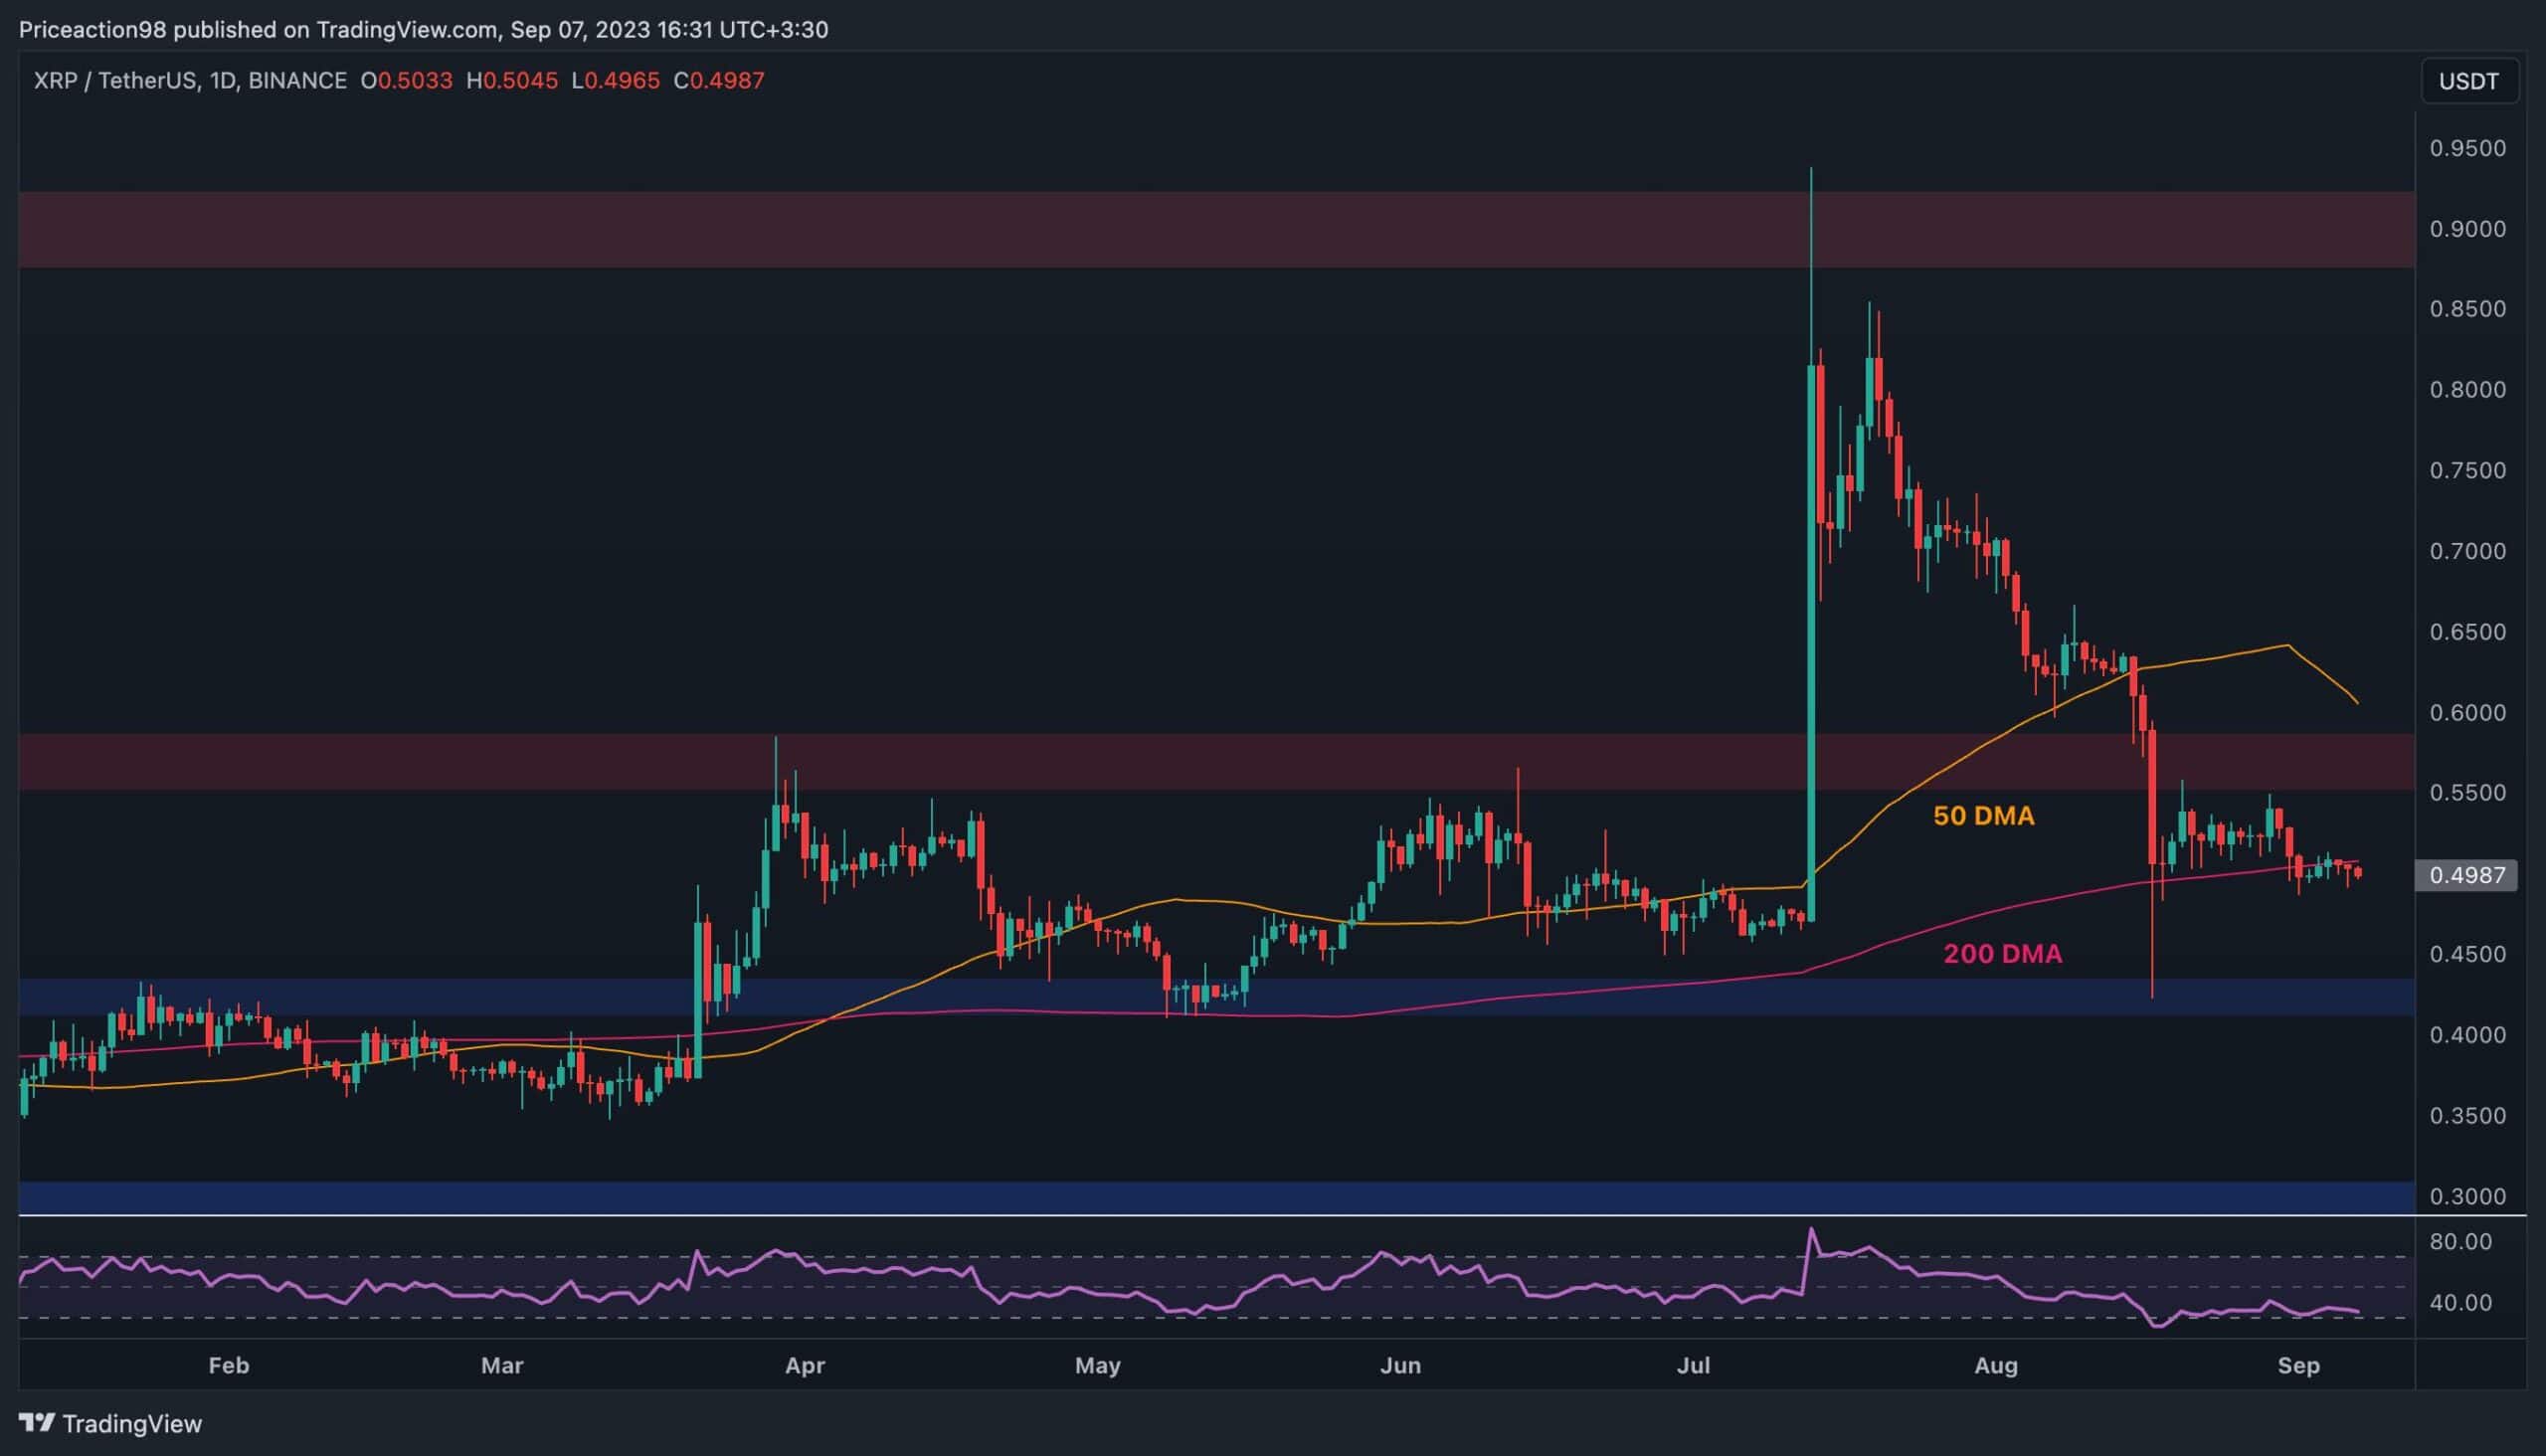
The USDT Paired Chart
On the USDT-paired chart, the price has been struggling to rebound after the recent drop from the $0.9 resistance level. The 200-day moving average, located around the $0.5 mark, is also failing to hold the market, as the price has been closing below it in recent days.
Considering the current market structure and the RSI indicator showing values deep below 50%, there is a high likelihood of a drop towards the $0.43 support level in the short term.

The BTC Paired Chart
Looking at the BTC-paired chart, things are quite similar. While the 200-day moving average, trending around the 1850 SAT level, is still intact on this chart, the price is making clear lower highs and lows, indicating a bearish market structure.
If the 200-day moving average and the 1800 SAT support level are broken to the downside, things will get ugly for Ripple, and the price could drop toward the 1500 SAT area in no time.

Binance Free $100 (Exclusive): Use this link to register and receive $100 free and 10% off fees on Binance Futures first month (terms).
PrimeXBT Special Offer: Use this link to register & enter CRYPTOPOTATO50 code to receive up to $7,000 on your deposits.
Disclaimer: Information found on CryptoPotato is those of writers quoted. It does not represent the opinions of CryptoPotato on whether to buy, sell, or hold any investments. You are advised to conduct your own research before making any investment decisions. Use provided information at your own risk. See Disclaimer for more information.
Cryptocurrency chartsby TradingView.